Choosing an appropriate Sensory data analysis tool
This guide will help you figure out which sensory data analysis methods best fit your question and data.
All the methods mentioned below can be found under the Sensory Data Analysis menu in XLSTAT, except for Principal Component Analysis, Multidimensional Scaling (both are found in the Analyzing data menu), PLS regression and ANOVA (Modeling data menu).

There are several types of sensory experiments
Difference experiments, where overall differences among products are evaluated by assessors. These experiments provide a global overview of the differences across products, without getting into detailed sensory characterization of products. They are useful when a new product is evaluated for the first time.
Sensory profile experiments, where several assessors rate several products over many attributes, and often over several sessions. More comprehensive sensory information can be acquired out of profile experiments, as compared to difference experiments. Typically, the following experiments are categories of sensory profile experiments:
-
Conventional Profiling, also referred to as Quantitative Descriptive Analysis (QDA).
-
The Spectrum Method.
-
Free Choice Profiling.
If the aim of the study is to optimize sensory characteristics of products to make them more desirable, some methods allow adding preference data measured on a quantitative scale.
Time related experiments, where the perception of attributes is evaluated through time.
Other miscellaneous sensory tools are available in XLSTAT and will be treated apart in this guide: TURF analysis and design of Sensory Wheels.
1. Difference experiments
In difference experiments, overall differences among products are evaluated. There are different kinds of difference experiments:
-
Experiences where assessors try to guess which product is a target product. In other words, these experiences help investigating whether a target product can be easily discriminated. Among many methods called Sensory Discrimination Tests, the triangle test is one of the popular tests used in this context. Assessors are presented with three products, including two similar products and a target product. Assessors should pinpoint the target product. Other tests available in XLSTAT are listed and explained here. It is important to wisely set up discrimination test experiments using the Design of Experiments for Discrimination tests feature for instance
-
Experiences in which several products are compared pairwise by assessors. For every pair, the assessor selects one product as the winner with regards to preference or to a specific attribute. The aim is to classify the products in terms of the attribute intensity or preference and to set a table quantifying the odds of selecting one product over another for each pair of products. The General Bradley-Terry model is used to analyze these data.
-
Another experience involves comparing several products pairwise. In this second case, for every pair, the dissimilarity or similarity between the two products is quantified numerically by the assessor. Multidimensional Scaling (MDS) draws a map of the products with distances on the map representing dissimilarity.
-
Free sorting experiences: products are sorted by assessors in groups of similar products. The Free sorting data analysis feature can be used to evaluate distance among objects based on free sorting data.
-
Projective mapping / napping experiences, where each assessor is given a tablecloth and asked to place products on it according to their dissimilarity (similar objects are placed close to one another on the tablecloth). Global dissimilarity among objects can then be analyzed using the STATIS feature, which aggregates object coordinates from all assessors.
2. Sensory profile experiments
Setting up the sensory profile experiment
First thing first, it is mandatory to organise the sensory profile experiment under several constraints while ensuring maximum usability for the collected data from a statistical point of view. Constraints can be a limited number of assessors and a limited number of products that can be tested by each assessor. Design of Experiments for Sensory Data Analysis helps achieving an optimal experimental design under the desired constraints.
Once the experiment is set, there are several ways to collect data. Sensory attributes can be measured on different scales:
-
Quantitative (numeric) scale: typically, 5, 7 or 9-point Likert scales or a line scale. The main advantage of this is scale is that it gives more precise results. The drawback is that it requires a deep training of the panel.
-
Just About Right (JAR) scale: usually measured on a 3 or 5-point scale where the middle point is the most desirable. Example: not salty enough – Just About Right – Too salty. Advantage: allows a finely tuned optimization of products through Penalty Analysis.
-
CATA (binary) scale: assessors only check the presence or absence of attributes in the products. Advantage: the convenience of the method makes untrained real-world consumers able to participate to the experiment.
Below is a typical data set from a sensory profile experiment. 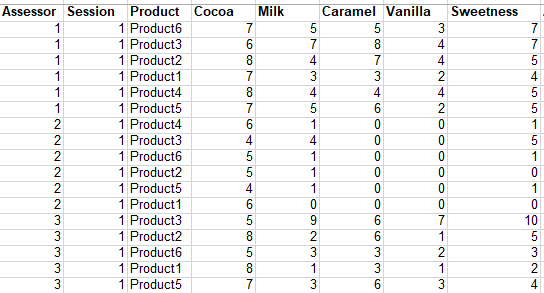
Once the data is collected, where to go? It all depends on the type of data you have and the question you are asking.
My ratings are quantitative. How can I have a global overview of the information lying behind the data I collected?
In other words, how can I globally visualize the relationships among sensory attributes, the relationships among products and the characterization of products with attributes? Multivariate techniques are quite useful in this context.
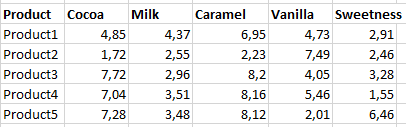
Classically, Principal Component Analysis (PCA) has been widely used for this purpose. Data should first be averaged across assessors to obtain one single row for each product and one single column per attribute (see table example below). Thus, PCA erases the specificities of each individual assessor. For instance, it ignores the fact that one assessor may rate attributes on wider scales or has a systematic higher rating than other assessors.
Generalized Procrustes Analysis (GPA) solves the PCA issue as it takes into account and corrects distortions of each individual assessor. Furthermore, GPA allows investigating consensus across assessors.
STATIS is another method which also considers assessor effects. Atypical assessors have less impact on the result, which is a good thing when atypical assessors are not representative of the population. STATIS is based on RV coefficients, which allow comparing numerically the ratings of assessors to one another or to the consensus.
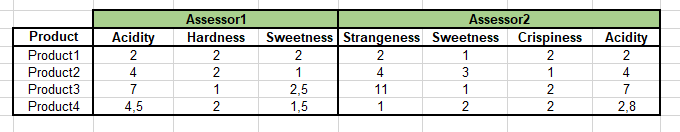
Both GPA and STATIS also allow investigating data from Free Choice Profiling, where rated attributes may change from one assessor to another (see table example below). This cannot be achieved using PCA.
Multiple Factor Analysis (MFA) can also be used in this framework. MFA is a general method for data exploration over many tables. In our situation, each assessor corresponds to one table (products - attributes). As a general method, MFA can also be used to uncover information on the relationships between different subsets of sensory attributes. For instance, in wine sensory evaluation, we could be interested by investigating the relationships between the following sets:
-
Set 1: 5 attributes corresponding to olfaction after rest.
-
Set 2: 3 attributes corresponding to visual criteria.
-
Set 3: 10 attributes corresponding to the olfaction after shaking.
-
Set 4: 9 attributes corresponding to the taste.
CLUSTATIS is a method for classifying subjects based on their perceptions of products. It allows to highlight the different points of view of the panel of subjects.
My ratings are quantitative. How reliable is my panel?
Here are the main characteristics of a good panel:
-
Assessors should discriminate products well.
-
Assessors should agree with one another.
-
Assessors should be consistent, or repeatable from one session to another.
Panel analysis allows for a deep investigation of these three components.
Semantic Differential Charts comparing assessor profiles across attributes for a given product help visualizing agreement between assessors.
My ratings are quantitative. How can I quickly characterize and compare products?
Traditionally, Analysis of Variance (ANOVA) is used to compare products to one another for each attribute. Attributes are the dependent (Y) variables. It is recommended to account for assessor effect by using two-way ANOVA with Product and Assessor as independent variables. If the global product effect is significant, multiple comparison procedures help finding out which specific products significantly differ from one another, while controlling for Type I error.
Unlike PCA, GPA and STATIS, the ANOVA method is univariate. It ignores the relationships between attributes. However, it offers significance testing which makes the investigation of product differences across attributes more precise.
Product characterization is another feature based on ANOVA. It helps to quickly pinpoint the specific sensory attributes which are significantly higher or lower than the average within each product.
Semantic Differential Charts are a good visualization tool for comparing products across attributes.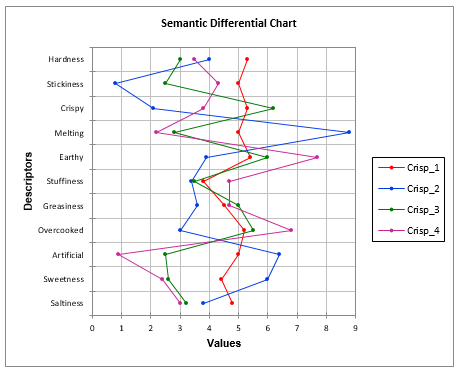
My ratings are quantitative. How can I relate sensory data to preference?
External Preference Mapping is a multivariate technique which models preference data according to sensory data (see data example in the picture below). Usually, the sensory space of products is represented on a PCA map, over which areas of high and low preference are added. External Preference Mapping helps directing the sensory development of a product toward areas of high preference.
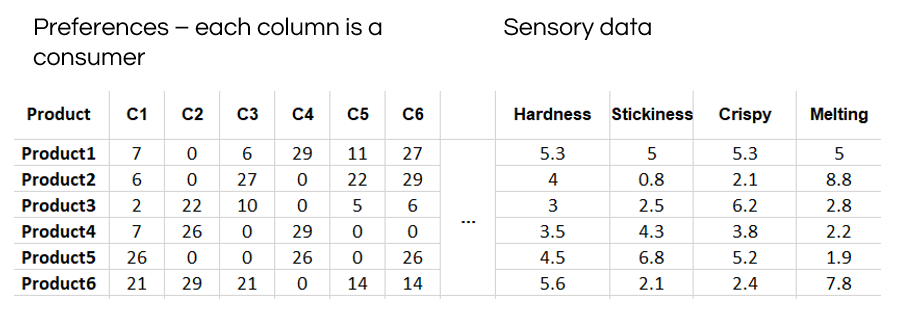
A great advantage of External Preference Mapping is that preference and sensory data should not necessarily be provided by the same panel. Thus, it is common to use consumer preference data, which is more representative of the real market.
Partial Least Square Regression (PLS) can also be used to model preference according to sensory evaluations of products. It is possible to choose either one single preference variable (which could be the average preference for each product), or a whole set of preference variables (one per consumer for instance, just like in the table above). PLS regression is also used to identify chemical drivers of sensory attributes, especially when the number of chemical compounds assessed is high, which is the case when using spectroscopy.
Internal Preference Mapping is another specific analytical tool that has been designed to analyse preference data on its own, without reference to the sensory space. It can be used to detect clusters of consumers with different preference profiles. Internal Preference Mapping is an adaptation of Principal Component Analysis with consumers as variables and products as observations.
My sensory data are measured on a JAR scale. How can I relate sensory data to preference?
Penalty Analysis is a specific method developed to relate Just-About-Right (JAR) sensory data to preference. An example of a JAR 3-point scale is: 1 = Not Sweet Enough; 2 = Just About Right; 3 = Too Sweet. Penalty Analysis allows for a finely tuned and quantified optimization of products. However, unlike External Preference Mapping, sensory and preference ratings should be provided by the same panel.
As the experimental designs for Penalty Analysis are simple and do not involve assessor effect, the Design of Experiments for Sensory Data Analysis feature cannot be used to generate a Penalty Analysis experiment.
My sensory data are CATA. How can I compare products and relate sensory data to preference?
CATA (Check-All-That-Apply) data analysis helps comparing sensory profiles of products measured on a binary scale (presence or absence of attributes). The simplicity of the CATA scale allows surveying untrained consumers representative of the real market.
If preference data are provided, CATA also helps identifying which attributes are must haves or must not haves in a product to optimize the preference score.
CATA data analysis involves a succession of statistical procedures including Cochran’s Q tests, Correspondence Analysis and Principal Coordinate Analysis.
CATATIS is another feature that offers an improvement over multivariate methods involved in CATA whenever it is advisable to limit the influence of atypical assessors.
CLUSCATA will build a subject classification based on product perceptions. This method is to be used in case of heterogeneity of the subject panel.
3. Time related experiments
When consuming food and drinks, our sensory experience changes through time. While all the methods cited previously rely on the static rating of sensory attributes, dynamic analysis methods can be used to explore sensory profiles throughout time.
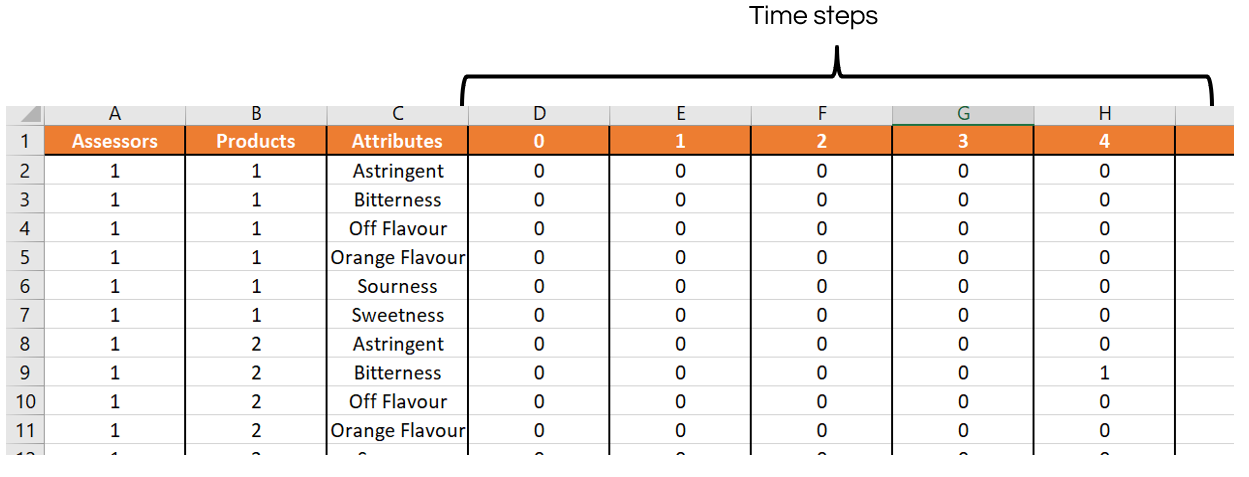
Temporal Dominance of Sensations (TDS).&text=Temporal%20Dominance%20of%20Sensations%3A%20Construction,and%20comparison%20with%20time%E2%80%93intensity.) and TCATA are two closely related features as they both allow comparing the temporal sensory profiles of different products. For each product and at each time step, assessors are asked to check whether an attribute is present or not (data table example below). While TDS is more visual and descriptive, TCATA involves significance testing of differences between products for each attribute at each time step. Also, TCATA includes a product trajectories map in the sensory space.
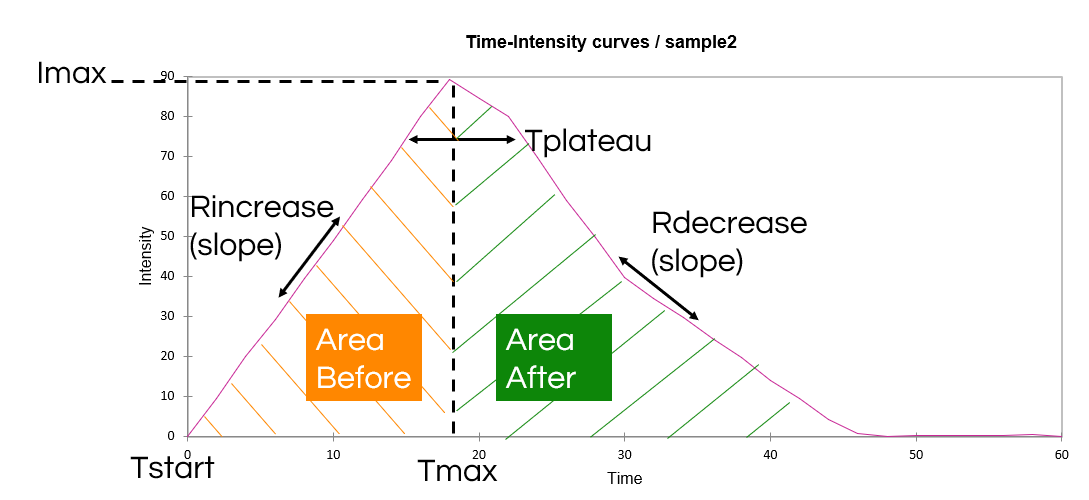
The Time-Intensity feature focuses only on comparing products over one single attribute through time. Input data must be quantitative. Each evaluation is hypothesized to be bell-shaped: attribute intensity increases then decreases through time. Several curve parameters (list) are measured by the software at each evaluation, and Analysis of Variance (ANOVA) is used to compare these parameters across products.
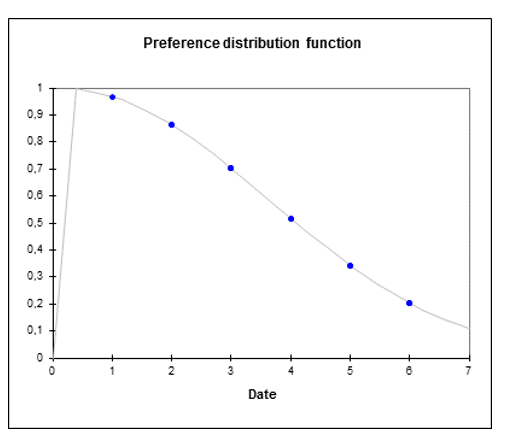
Sensory Shelf Life Analysis allows evaluating the best period to consume a product before it loses too much preference or desirable sensory properties, and thus define expiry dates. It is based on parametric survival models.
Which combination of products from a brand should be highlighted to reach a maximum number of consumers?
When several products are produced by the same brand, it could be interesting to identify which subset of products from the brand would maximize reach when displayed on a supermarket shelf, for instance. The subset could be a combination of 6 preferred flavors selected among a set of 30 available flavors in an ice cream brand. TURF analysis (Total Unduplicated Reach and Frequency) helps identifying the best product combination based on consumer rating data for all the available products.
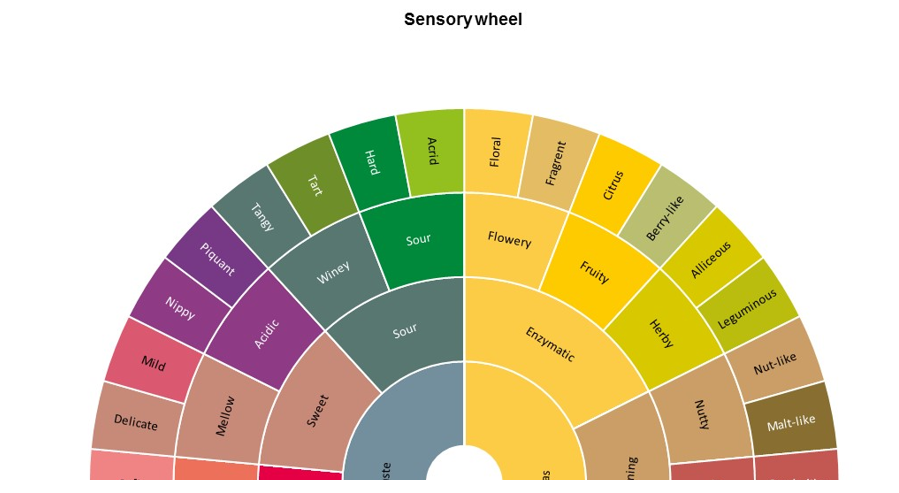
How to design a user-friendly sensory descriptive guide including a hierarchy in attributes?
The Sensory Wheel is a visual guide which helps assessors characterize specific products with different levels of precision. XLSTAT offers a tool to easily design a sensory wheel. Below is a reproduction of the coffee tasters’ sensory wheel (coffeeandhealth.org).
Was this article useful?
- Yes
- No