Sensory shelf life analysis in Excel tutorial
This tutorial will help you set up and interpret a sensory shelf life analysis in Excel using the XLSTAT statistical software.
Dataset for sensory shelf life analysis
The data used in this tutorial correspond to the evaluation of a fresh fruit juice by 19 assessors at different times. The juices have been tested 6 times at day 1, 2, 3, 4, 5 and 6. The assessors have given their liking (yes/no) for all these times. In the data, the assessors' evaluations are coded using 0 when the evaluation is negative and 1 when it is positive.
Here is the data format:
 You can change the value (0/1) to any other value in XLSTAT (yes/no for example).
Goal of the sensory shelf life analysis
The goal of this analysis is to visualize the best period to put a product in a shelf for selling it. Parametric survival models are used to model the time at which an event occurs.
Setting up a sensory shelf life analysis
Once XLSTAT is activated, select the XLSTAT-Sensory data analysis / Sensory Shelf Life Analysis command (see below), or click the corresponding button of the XLSTAT-Sensory data analysis toolbar.
 Once you have clicked on the button, the dialog box appears. Select the assessor x date table as presented above and a column with the value associated to each date in the time data box. We use the Weibull distribution to fit the model.
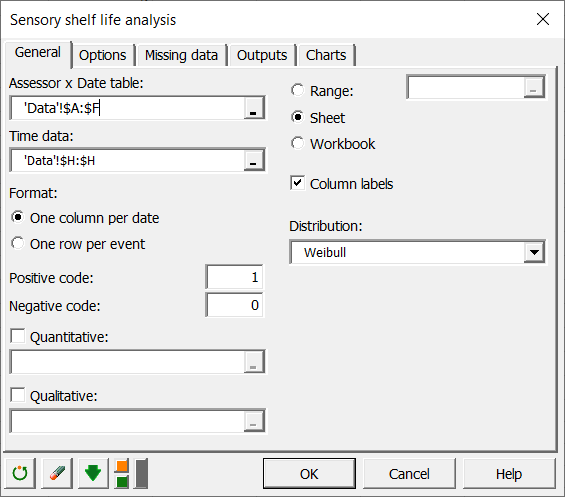
Other options are left with their default values.
Interpreting the results of a sensory shelf life analysis
After you have clicked on the OK button, the computations start.
The first table corresponds to basic summary statistics associated to the time data. A graphic is also displayed giving an overview of the answers of the assessors.

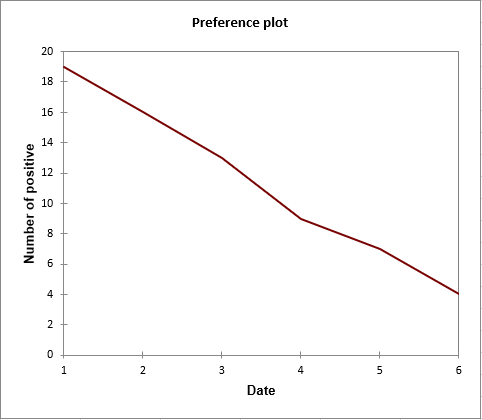
This plot shows a decrease in the number of assessors that appreciate the orange juice. At the end of the analysis, only 4 assessors still like the product.
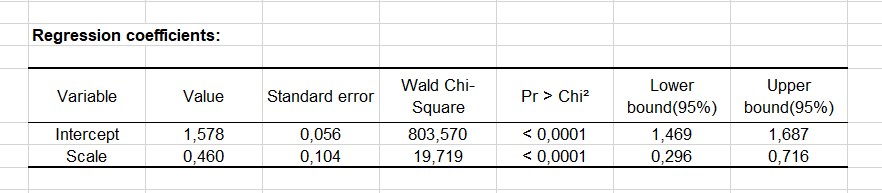
The tables displayed afterward are similar to those displayed in a parametric survival curve. A Weibull curve is fitted to the model. We can see that both parameters are significant.
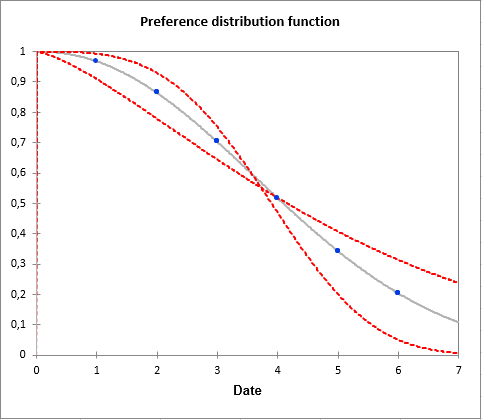
The preference distribution function plot based on a Weibull distribution is as follows :
 Finally, the quantiles are obtained and are very useful for decision making.
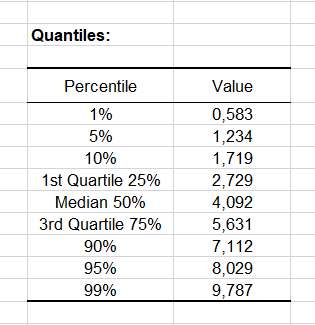
We can see that median time is between 4 and 5 days after the product has been put on the shelf.
Many more analysis and decisions can be taken with sensory shelf. Explanatory variables associated to each assessor can be added.
Was this article useful?
- Yes
- No