Time-Intensity analysis in Excel
This tutorial will show you how to run a Time-Intensity analysis in Excel using the XLSTAT software.
The goal of this tutorial
This tutorial uses a simulated dataset of Time-Intensity (TI) data as it would have been created after a Time-Intensity evaluation. In our example, the sweetness of two beverages, product A and product B, has been evaluated by a trained panel of assessors, Judge A, B, C, D, E, and F during 2 sessions. Assessors were asked to score the perceived intensity of the sweetness of the beverage over time. A data point was acquired every 2 seconds and the total duration of the measurement was 60 seconds.
Compared to single-point measurements, the analysis of the development and decline of particular sensory characteristics may reveal rich information in order to distinguish products or perceptions. This type of analysis may be applicable to a variety of products, ranging from the level of sweetness of a beverage to the feeling left by lipstick.
Setting up a time-intensity analysis with XLSTAT
-
Open XLSTAT.
-
Select the XLSTAT / Advanced feature / Sensory data analysis / Time-intensity. The dialog box pops up.
-
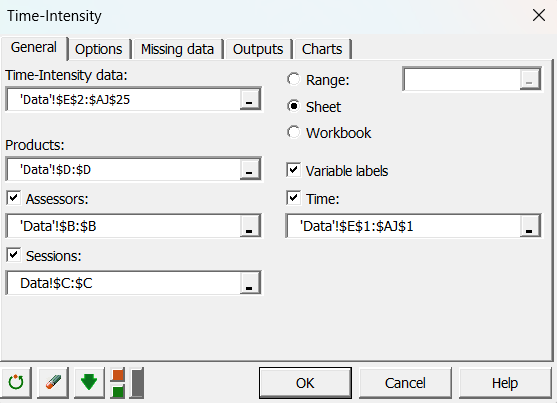
Select the Time-Intensity data and the Products identifier.
-
Activate the data fields Assessors, Sessions, and Time as we have the corresponding identifiers vector.
-
The Variable labels checkbox should be ticked.
-
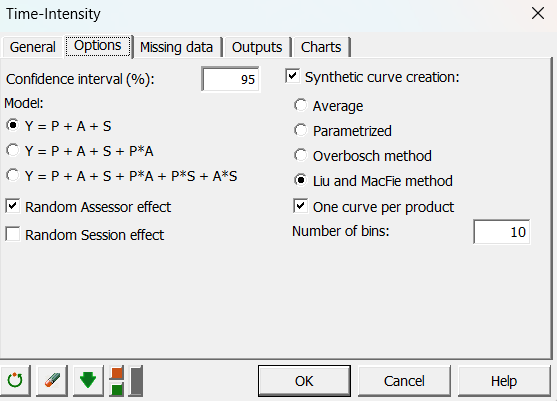
In the options tab, choose the first configuration where no interaction between Product, Assessor, or Session is considered, among the 3 model configurations proposed for the ANOVA to be performed on the extracted parameters.
-
Activate the option Synthetic curve creation and select Liu and MacFie method, as we wish to generate one synthetic curve per product.
-
Leave the number of bins at the default value of 10.
-
Click on OK.
Interpreting the results of a Time-Intensity analysis
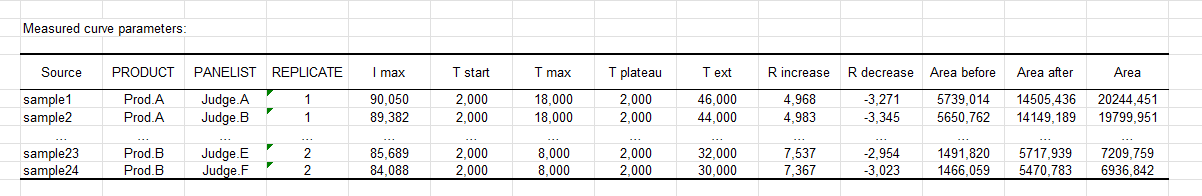
The following table shown below summarizes the measured curve parameters. Those are the 10 descriptive quantities measured on the 24 individual intensity curves. The table also indicates the corresponding Product, Assessor, and Session so that all the information is gathered in a single table.
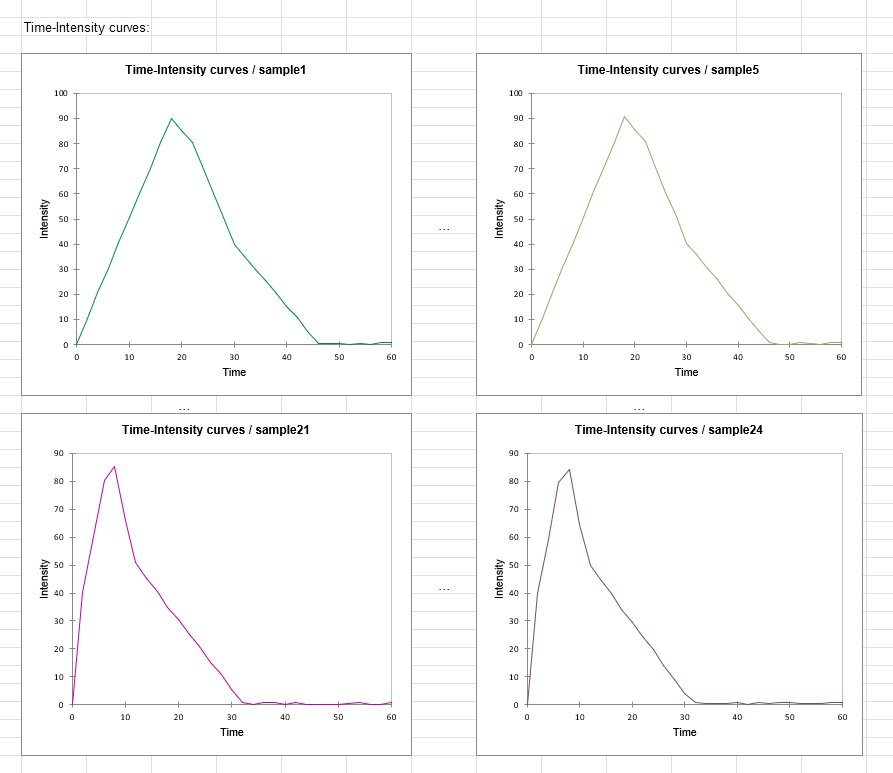
The parameter table is followed by a group of charts displaying the individual Time-Intensity curves, shown below. Each curve is displayed on a single chart. It is important in a Time-Intensity analysis to visually control the individual TI curves. The user should use his field expertise to identify potential recording issues.
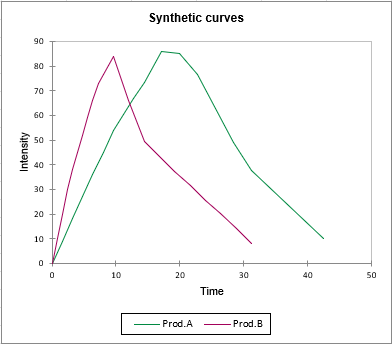
The chart that follows is the synthetic curve chart. As shown below, it gives the intensity and time coordinates of both synthetic curves, the one for product A and the one for product B.
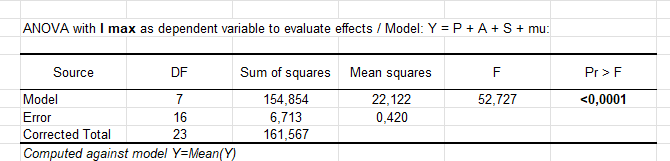
Finally, a list of the results of ANOVA performed with each parameter considered as the dependent variable is displayed. The objective is to check if there is an effect.
In our example and according to the p-value, I max has a significant effect.
Conclusion
Using the XLSTAT statistical software, we were able to perform of Time-Intensity analysis on a simulated data set. The measured curve parameters were extracted by the algorithm and we could control that the individual TI curves were all fine. We also generated a synthetic curve following the approach proposed by Liu and MacFie and compared the results for both products.
Was this article useful?
- Yes
- No