Sensory product characterization in Excel tutorial
This tutorial helps you set up and interpret a sensory product characterization in Excel using the XLSTAT statistical software.
Dataset for product characterization
The data correspond to a sensorial test on 6 chocolate drinks (Husson F. & Pagès J. (2003). Comparison of sensory profiles done by trained and untrained juries: methodology and results, Journal of Sensory Studies, 18 (6), pp. 453-464). 29 assessors have tested 6 drinks and gave grades on 16 characteristics. There has been two testing sessions. We won’t use the session factor in this tutorial.
Goal of this tutorial
Our goal is to quickly find the main characteristics of the chocolate drinks.
Setting up a product characterization
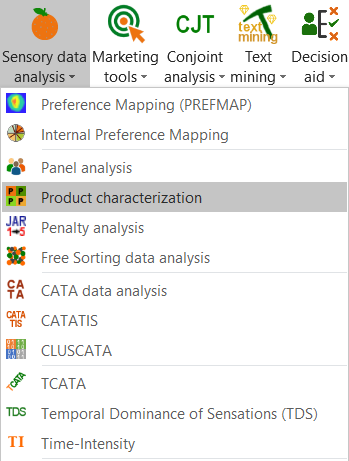
After opening XLSTAT, click the Sensory data analysis button in the ribbon and select Product characterization (see below).
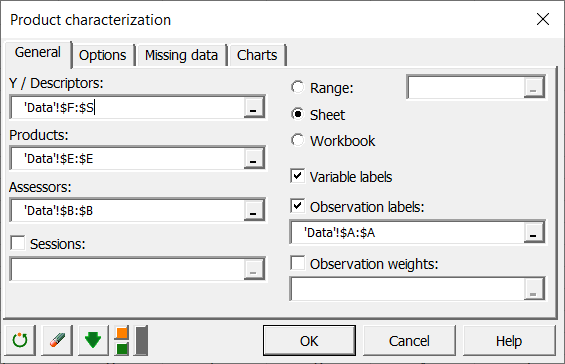
 Once you've clicked on the button, the dialog box appears. Select the data on the Excel sheet.
You have first to select the descriptors (or characteristics), then the products column and the judges column. As we selected the column title for the variables, we left the option Variable labels activated.
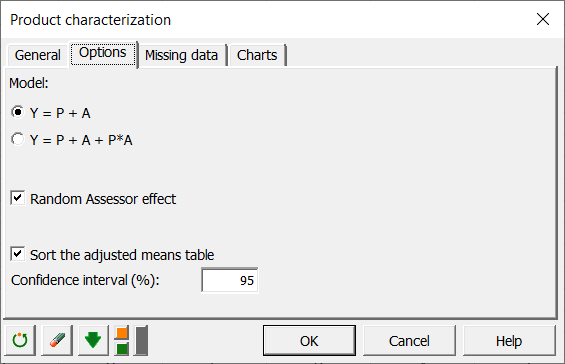
In the options tab, we select the simplest model Y=P+J.
Once you have clicked on the OK button, the computation starts. The results will then be displayed.
Interpretation of the results of a product characterization
The first results displayed by XLSTAT are the basic statistics associated to the characteristics and to the judges and products columns.
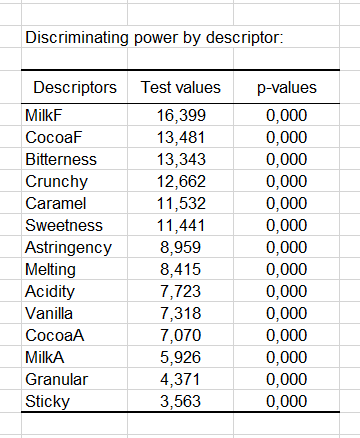
Then, the second table contains the characteristics ordered from the one that has the highest discriminating power to the one that has the lowest discriminating power on the chocolate drinks. We can see that the milk taste has a high discriminating power. Associated test values and p-values are also displayed.
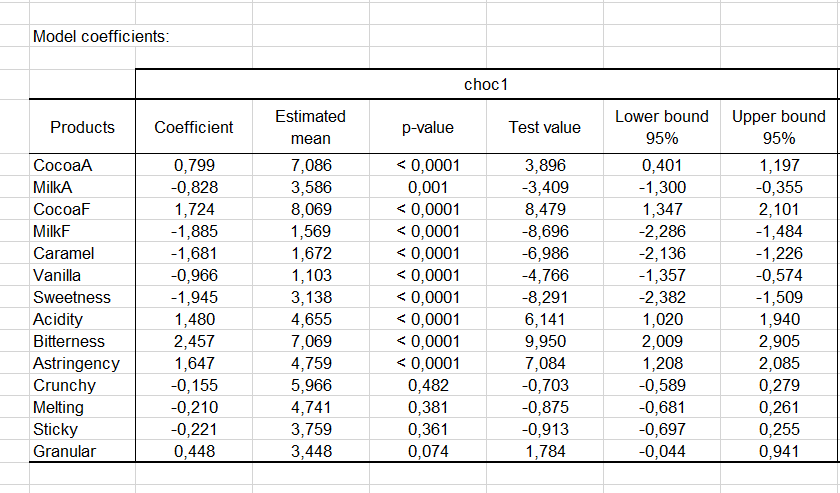
The next table, which appears partially bellow (only for choc1), contains the most important outputs of the analysis of variance models (here we have applied 16 analysis of variance models). Models coefficients, estimated means, test values and confidence intervals are displayed.
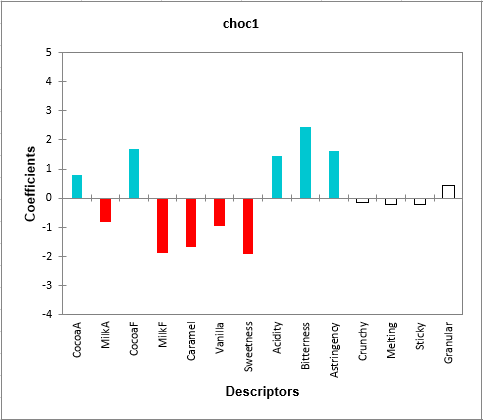
 The following graphic is very helpful to define our product (here choc1). The blue color is associated to coefficients that have a significant positive value and the red color is associated to coefficients that have a significant negative value. We can see that choc1 has a cocoa aspect (cocoa), it is strongly bitter and acid. It is not sweet and does not taste like milk.
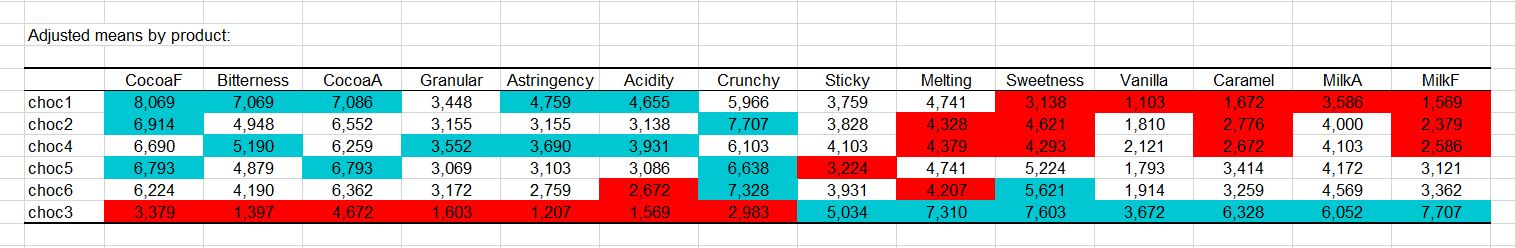
Finally, the last table corresponds to the adjusted means for each combination product-characteristic. The blue color corresponds to means that are significantly greater than the global mean and the red color corresponds to means that are significantly smaller than the global mean. We can see very quickly, that choc1 is a product with a cocoa taste and aspect and which is bitter and acid. Choc3 is a chocolate drink which is very sweet and has a strong milk taste.
 This quick analysis gives us a clear view of our products. The characterization of products is in the same time a very rigorous method (using statistical methods) and a very easy to interpret tool.
Was this article useful?
- Yes
- No