One-way ANOVA & multiple comparisons in Excel tutorial
This tutorial shows how to set up and interpret a one-way Analysis of Variance (ANOVA) followed by Tukey & Dunnett multiple comparisons in Excel using the XLSTAT software.
Dataset for running a one-way ANOVA
The data correspond to an experiment where 4 new toothpaste formulas were each tested on 6 different patients in order to measure their effect on the whiteness of teeth. All patients had previously used the same toothpaste.
Goal of this tutorial
Using the ANOVA function of XLSTAT we want to find out if the results differ according to the formula used and, if so, which formula is the most effective. The case is a one-way balanced ANOVA because there is only one factor - the formula - and the number of repetitions is the same for each formula.
Setting up the one-way ANOVA
-
Open XLSTAT.
-
Select the XLSTAT / Modeling data / ANOVA command. Once you have clicked on the button, the ANOVA dialog box appears.
-
Select the data on the Excel sheet. The Dependent variable corresponds here to "Whiteness" which variability we want to explain by the effect of the "Toothpaste" formula, the latter being the Qualitative explanatory variable.
-
Make sure to check the option Variable labels.
In this example we want to display the results on the same sheet where the data are stored, so we chose the Range option and selected the cell that corresponds to the top left corner of the results report to be displayed.
In XLSTAT, it is possible to select the data in two different ways for the ANOVA. The first is in the form of columns, one column for the dependent variable, and another for the explanatory variable.

The second way to select the data is in tabular form, with each column representing a modality of the explanatory variable.


-
In the Options tab, leave the constraint option at a1=0. This means that we want the model to be built using the assumption that the T1 toothpaste has the basic effect on whiteness: we know the average for T1 is the lowest and this guarantees that the other effects will be positive.
-
Applying a constraint to the ANOVA model is necessary for theoretical reasons, but it has no effect on the results (goodness of fit, predictions). The only difference it makes is in the way the model will be written.
-
In the Outputs tab (Means sub-tab), check a Tukey's test and a REGWQ test in the Pariwise comparisons field.
-
Activate the Comparisons with a control option to run a two-sided Dunnett's test.
-
Click OK to launch the computations.
-
In the control category selection dialog box, choose the T1 control group for the Dunnett test.
-
Once you click on the OK button, the computations resume, and the results are displayed.
Interpreting the one-way ANOVA results
The first results displayed by XLSTAT are the goodness of fit coefficients, including the R² (coefficient of determination), the adjusted R², and several other statistics.

The coefficient of determination (here 0.56) gives a fair idea of how much of the variability of the modeled variable (here the whiteness) is being explained by the explanatory variables (here the type of toothpaste); in our case, we have 56% of the variability explained. The other 44% are hidden in other variables which are not available, and which the model hides in "random errors".
The analysis of variance table is a very important result to look at (see below). This is where we determine whether the explanatory variable (the toothpaste formula) brings significant information (null hypothesis H0) to the model or not. In other words, it is a way of asking yourself whether it is valid to take the mean to describe the whole population, or if the information provided by the categories (here the toothpaste type) is of value or not.
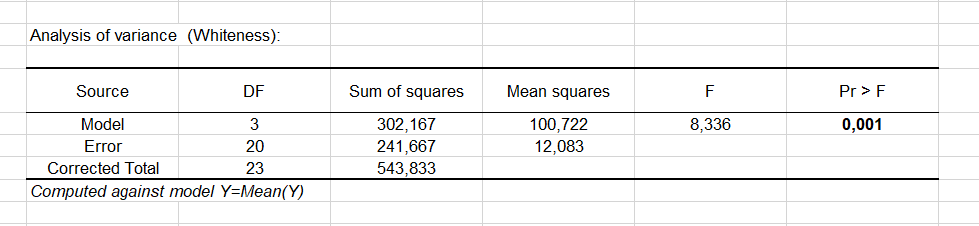
The test used here is the Fisher's F test. Given that the probability corresponding to the F value, in this case, is 0.001, it means that we would take a 0.1% risk to conclude that the null hypothesis (no effect of the toothpaste formulas) is wrong.
So we can conclude with confidence that there is an effect of the toothpaste formulas on the whiteness of the patients' teeth. Note that the R² is not very good (0.56), meaning that some of the information offering a complementary explanation of the variations of the whiteness is missing, which is no real surprise.
The following table gives details on the model. This table is helpful when predictions are needed. In this particular case, it is not very useful. We can already notice that the toothpaste T2 has an effect in which the 95% confidence range includes 0, indicating that there is no evidence that T2 is very different from T1.

The bar chart of the standardized coefficients allows us to visually compare the relative impact of the categories and to see if the confidence intervals include 0 or not.

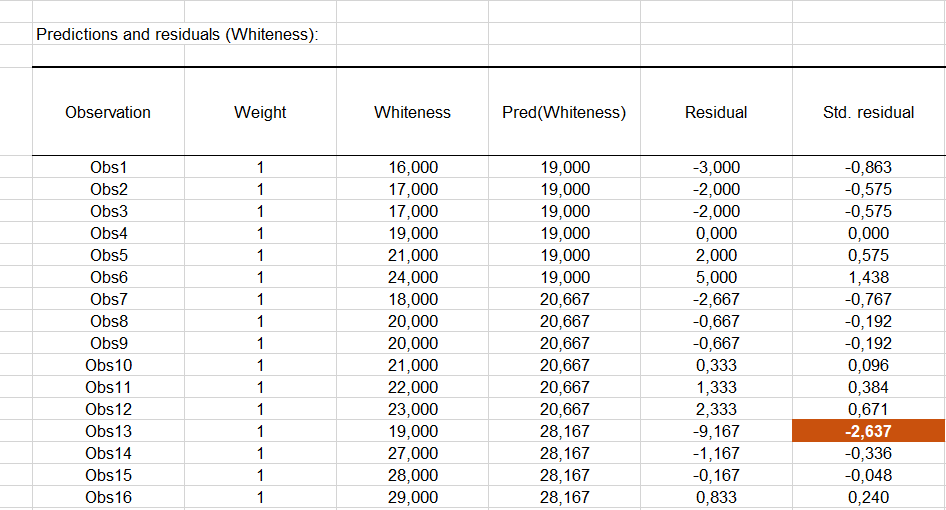
The next table shows the residuals. We can look at the reduced residuals (standardized residuals) more specifically, residuals which, given the assumptions of the ANOVA model, should be normally distributed. This means, among other things, that 95% of the residuals should be in the interval [-1.96, 1.96].
All values outside this interval are potential outliers or might suggest that the normality assumption is wrong. It seems here that there is one strong outlier (3rd observation) with a standard residual equal to -2.64.
To explain the difference, one should first verify that the right toothpaste was given to the 3rd patient, and secondly, one should try to understand why the response to the formula wasn't the same as for the other patients.
The histogram of the standardized residuals allows us to quickly visualize the standardized residuals that are out of the expected range.

Now we obtain the answer to our initial question: is there a significant difference between the treatments, and how should this difference be classified?
As shown in the next table, the Tukey's HSD (Honestly Significantly Different) test is applied to all pairwise differences between means. The risk of 5% we have chosen is used to determine the critical value q, which is compared to the standardized difference between the means.
Based on the p-values below (Pr>Diff), only two pairs appear to be significantly different (T1, T3) and (T2, T3). This can also be confirmed by the 95% confidence intervals (last four columns). If an interval does not contain zero, then we can reject the null hypothesis that there is no significant difference between the two means.

The REQWQ procedure gives different results (see below), which shows that one needs to be very cautious when using comparison methods.
Three pairs of categories are different in this case (T1 and T4 appear to be significantly different with this method). The groupings give now three superimposed groups of categories.

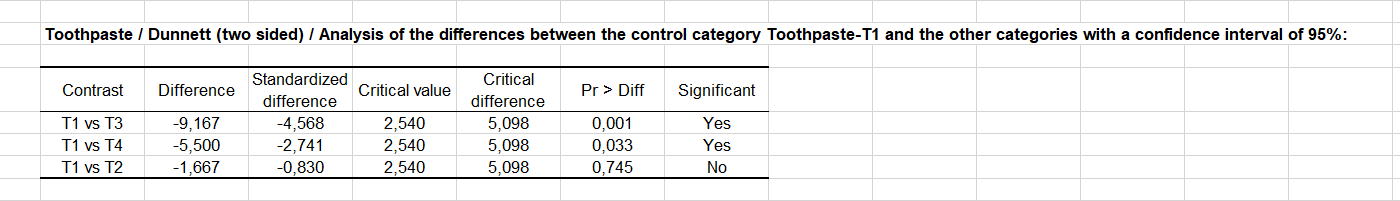
Next, we performed a Dunnett's test to compare each category with the control category T1. The Dunnett's test agrees with the REQWQ procedure that the T1 and T4 categories are significantly different.
Conclusion for this one-way ANOVA
The conclusion is that the 4 toothpaste formulas show significantly different effects on whiteness. As the T1 toothpaste is already on the market, it is the toothpaste T3 or T4, which shows a significant increase in whiteness, which should be selected as a newcomer to the market.
Please notice that ANOVA relies on parametric assumptions that must be verified to ensure the reliability of the output.
Was this article useful?
- Yes
- No