Design an experiment for sensory analysis in Excel
This tutorial will help you design an experiment for sensory analysis in Excel using the XLSTAT statistical software.
Design of Experiments for sensory analysts
Designing an experiment is a fundamental step for anyone who wants to ensure that data collected will be statistically usable in the best possible way. This tool is designed to provide specialists in sensory analysis with a simple and powerful tool to prepare a sensory evaluation where judges (experts and/or consumers) evaluate a set of products.
When you want a panel of consumers to evaluate a set of products, say 8, the first issue that arises is the appropriate number of consumers that should be involved, knowing that there may be technical constraints, or budgetary constraints. Once the number of consumer is defined, for example 60, the next question that arises, is finding the maximum number of products that a consumer can evaluate during each session. Because of physiological constraints: a consumer, even trained, may not necessarily retain its sensory capabilities to rate too many products at once. Imagine that the experiment shows that three products is a maximum for a session and only two sessions can be arranged. Each consumer can then evaluate a maximum of 6 products.
It remains to determine which products will be evaluated by each of the 60 consumers in each session, and in what order. To avoid penalizing certain products we should ensure that products are seen as often as possible in the three different positions during each session.
When generating the plan we therefore try to reconcile the following three requirements:
- Products must be seen by as many judges as possible and with an overall frequency of the different products as homogeneous as possible,
- Each product must be seen in the different orders during each session, with an overall frequency for each pair (order, product) as homogeneous as possible
- The different ordered pairs of products must be present in the design of experiments with a frequency as homogeneous as possible.
Setting up a design of experiments for sensory analysis
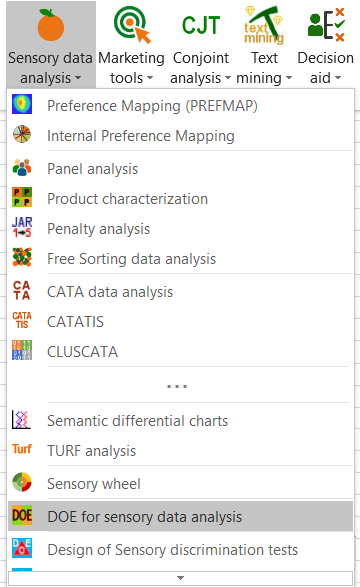
After opening XLSTAT, click the Sensory data analysis button in the ribbon and select DOE for Sensory Analysis (see below).
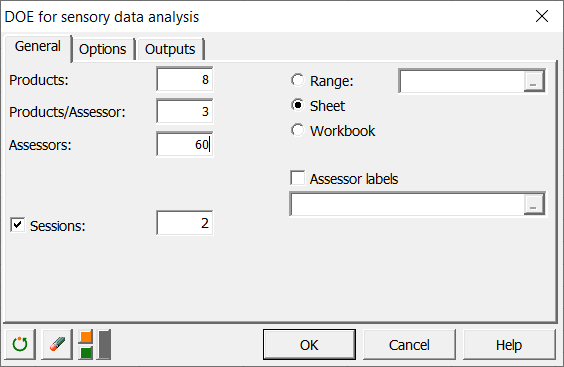
Once you've clicked the button, the dialog box appears. Enter the number of products, the number of products tested by each judge, the number of judges and the number of sessions.
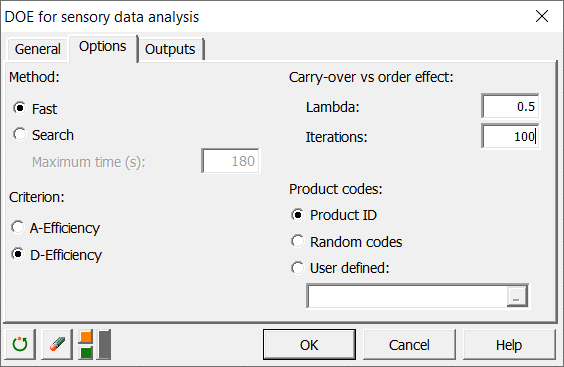
 In the Options tab, we select the fast algorithm, the determinant and a lambda of 0.5 (for more details, see the help of XLSTAT).
 Once you have clicked on the OK button, the computations start. The results are then being displayed.
Interpreting the suggested design of experiment
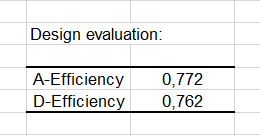
Results for all sessions taken together are first displayed, followed by the results for each session. The first result displayed by XLSTAT is a table with the A-efficiency and D-efficiency criteria.
 The second table contains the design as it has been generated. Each row corresponds to a judge and each column to an experiment. There are 60 rows and 3*2 columns. You can find an extract of this table below.
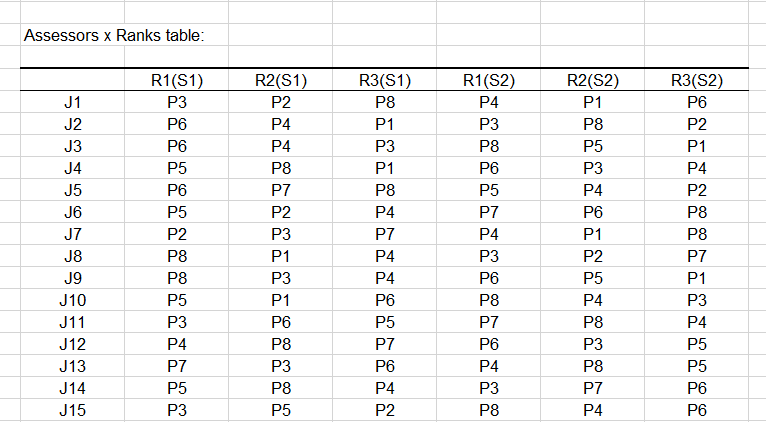
The experiment can be run using this table.
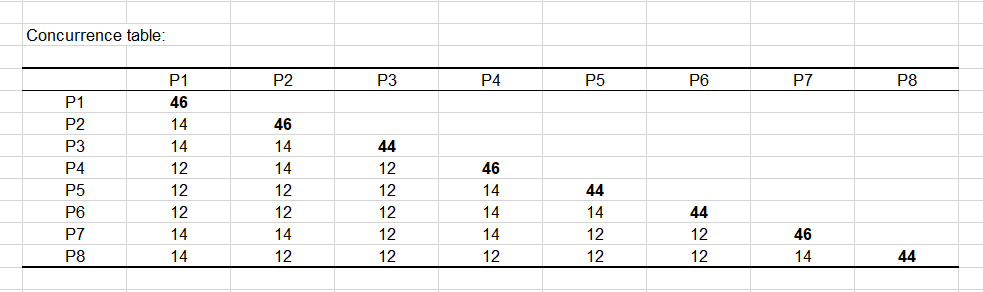
The next tables are displayed in order to better understand the preceding one. They concern both sessions. The concurrence table shows how many times two products have been rated by the same judge.
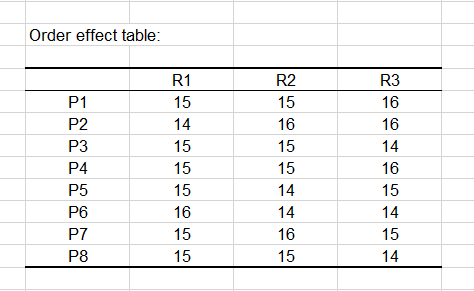
 The Order effect table shows how many times each product has been rated at a given step of the experiment. It should be as close as possible to a constant table.
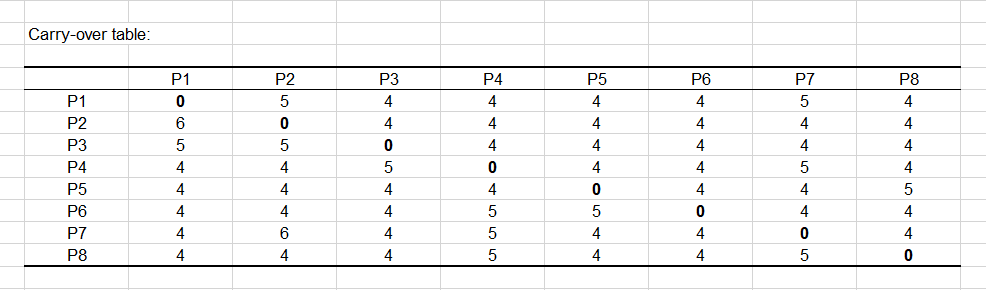
The carry-over table shows how many times each product has been rated just after another one. It should be as close as possible to a constant table.
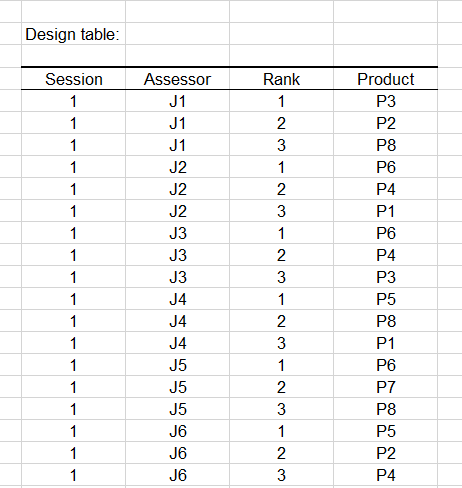
 The design table can later be used for an ANOVA, once the ratings given by the judges have been recorded. It includes four columns (session, judge, rank and product) and has 2*60*3 = 360 rows. Once the table has been completed with the ratings, you can use the ANOVA function of XLSTAT-Pro or the "Product characterization" tool included in XLSTAT-Sensory data analysis to compare the products.
 The remaining outputs correspond to details for each session.
Was this article useful?
- Yes
- No