Multivariate analysis and clustering on JAR (Just-About-Right) data in Excel
Jar data to analyze
The dataset provides valuable information on 72 assessors evaluating 8 different cheeses based on 9 JAR attributes.
Setting up the JAR Multivariate analysis and clustering in XLSTAT
-
Open XLSTAT.
-
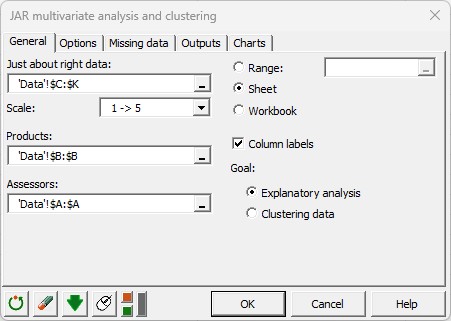
Select the XLSTAT / Sensory data analysis / JAR Multivariate analysis and clustering. The dialog box pops up.
-
In the XLSTAT interface, select the just-about-right data corresponding to the descriptors.
-
Identify the scale corresponding to the JAR data.
-
Select the data corresponding to the product identifiers.
-
Select the data corresponding to the assessor identifiers.
-
Choose between the Explanatory analysis (CATATIS) and clustering analysis (CLUSCATA).
-
In the options tab, enter beta, the parameter for agreement between JAR and other answers.
-
Click on OK.
Interpret multivariate analysis of JAR data
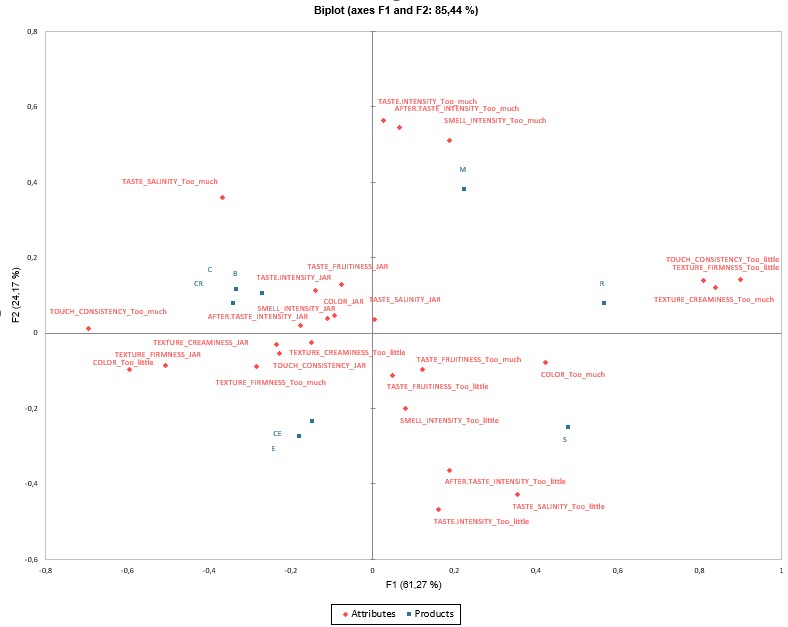
The products/assessors table is displayed first, then all the results for the CATATIS method adapted to JAR data.
For example, we can see that product R is characterized by too little texture and consistency, and is too creamy.
For a better understanding of the results, please see Analysis of CATA data with CATATIS in Excel.
Interpret JAR data clustering
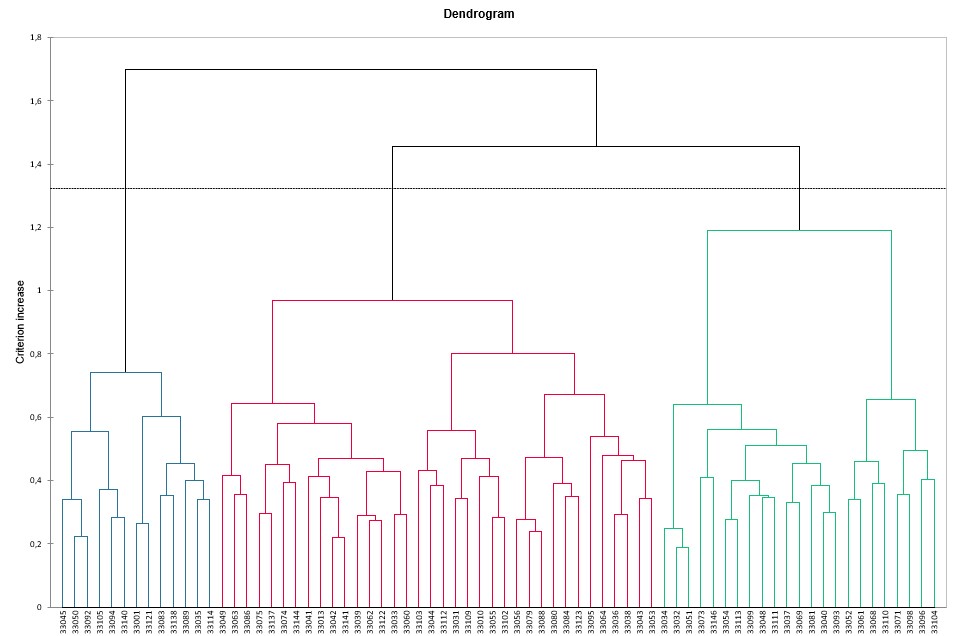
The products/assessors table is displayed first, then all the results for the CLUSCATA method adapted to JAR data.
Three clusters of assessors could be considered here.
For a better understanding of the results, please see Clustering subjects in a CATA task by means of CLUSCATA.
Was this article useful?
- Yes
- No