RATA data analysis in Excel
This tutorial will show you how to run and interpret a RATA data analysis in Excel using the XLSTAT statistical software.
Dataset for RATA data analysis
The data used to illustrate the RATA feature relates to a Rate-All-That-Apply (RATA) experiment in which 9 assessors evaluated 12 chocolates using 13 attributes over 3 sessions.
Setting up the RATA analysis
-
Open XLSTAT.
-
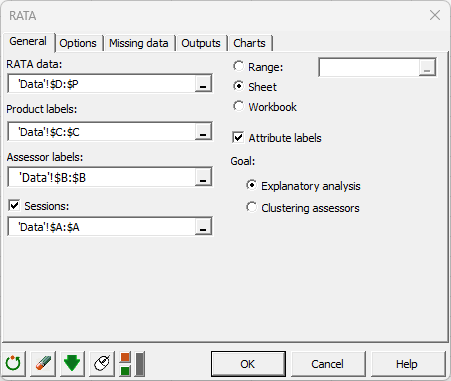
Select the Advanced features / Sensory data analysis / RATA data analysis. The dialog box appears.
-
In the XLSTAT interface, select the RATA data corresponding to the attributes.
-
Select the data corresponding to the Product labels.
-
Select the data corresponding to the Assessor labels.
-
Select the data corresponding to the Session.
-
In the Outputs tab, choose between CA or PCA for Dimension Reduction.
-
The computations begin once you have clicked on the OK button.
Interpreting the results of RATA data analysis
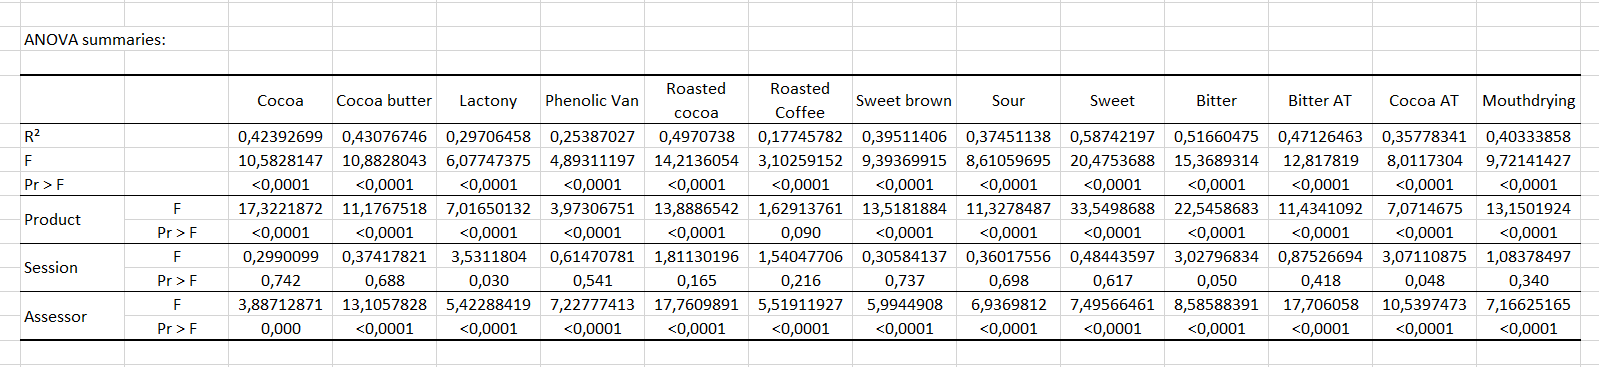
The first important result of the RATA feature is the table summarising the ANOVAs for each attribute. In this table, we can see that for all the attributes except Roasted Coffee, the Product variable is significant at the 5% threshold, which means that these attributes are discriminating.
Another important result of the RATA feature is the graphical representation of products and attributes. On the following chart, we can see that we have 88.14% inertia reported by our first two axes, so we can be satisfied with these two. The chart shows an opposition between bitter flavours (roasted cocoa, sour...) and sweet flavours (cocoa butter, sweet...). Choco72 is seen as a smooth chocolate, while Choco86 is more bitter.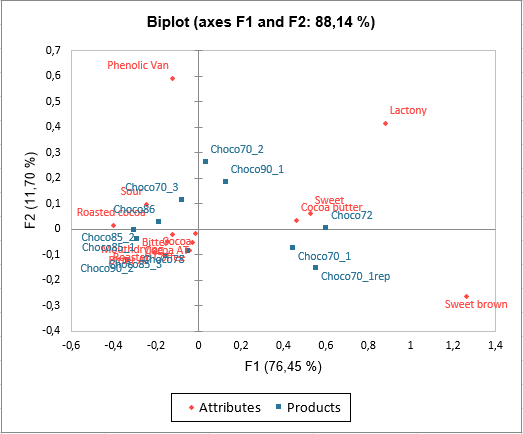
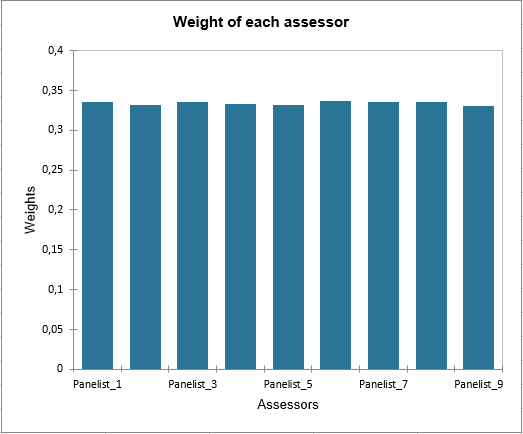
The last important result is the weight given to each assessor. Indeed, the lower the weight of a judge, the more atypical his point of view is. For example, here the weights are very similar from one assessor to another, so there are no atypical individuals in this dataset. This conclusion is confirmed by the homogeneity value, whose maximum value is 1, and which here is 0.92.
In the RATA analysis, it is also possible to use the CLUSCATA algorithm to construct groups of subjects with different points of view automatically.
Was this article useful?
- Yes
- No