Create a Products/Assessors table in Excel
Transform Sensory Data into a Products/Assessors Table with XLSTAT
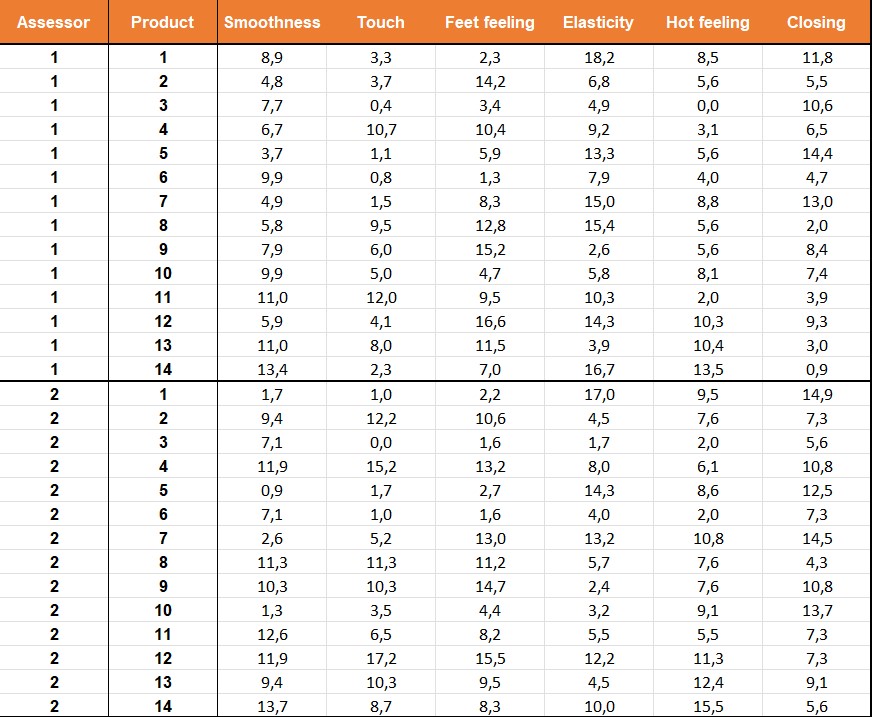
This tutorial demonstrates how to transform sensory data into a Products/Assessors table using XLSTAT. The virtual dataset used in this example consists of 210 samples, where 15 assessors evaluated 14 products based on 6 descriptors. A sample view of the data is shown below:
Create a Products/Assessors table in XLSTAT
-
Open XLSTAT.
-
Select the XLSTAT/ Sensory data analysis / Create a Products/Assessors table.
-
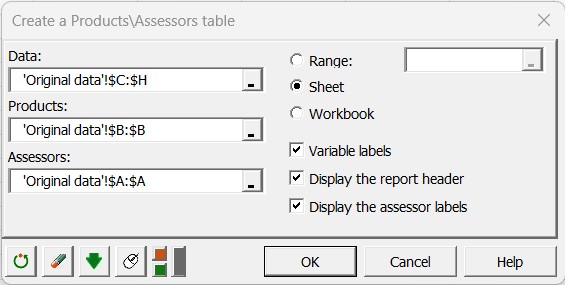
The dialog box pops up.
-
In the XLSTAT interface, select the data corresponding to the descriptors, the product identifiers, and the assessor identifiers.
-
Click on OK.
Interpret the Products/Assessors table
The resulting report provides an overview of the data, including the number of assessors, products, and sessions.
The Product/Assessor table is displayed, with the following features:
-
The first row shows the labels of the assessors.
-
The second row displays the labels of the descriptors.
-
The first column contains the labels of the products.
-
The body of the table presents the data organized by assessors.
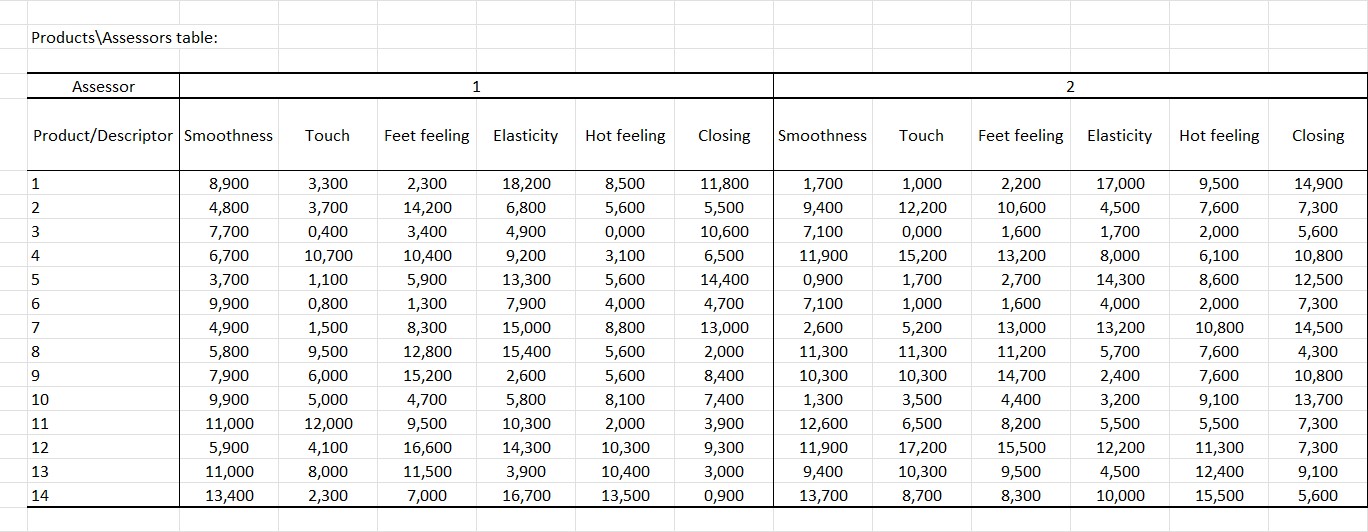
By examining the table, you can gain insights into your data and understand how different assessors rate various products based on the given descriptors.
Was this article useful?
- Yes
- No