Flash Profiling in Excel
This tutorial will show you how to run and interpret a Flash profiling analysis in Excel using the XLSTAT statistical software.
Dataset to Perform a Flash Profiling Analysis
The data used to illustrate the Flash profiling feature relates to an experiment of the same name in which six evaluators rated six brands of chips using attributes of their choice.
How to Configure the Flash Profiling?
-
Open XLSTAT.
-
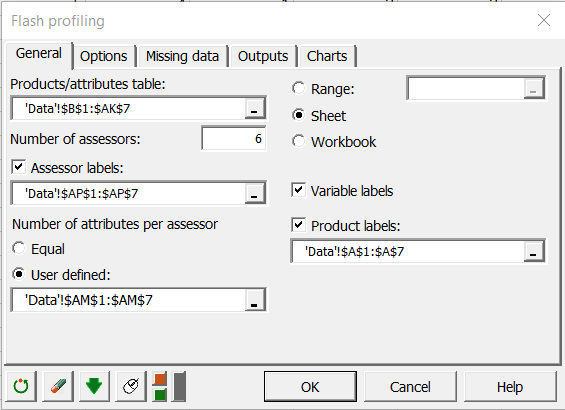
Select the Sensory / Rapid tasks / Flash profiling. The dialog box appears.
-
In the XLSTAT interface, select the Products/attributes table. It contains your Flash profiling data with assessors tables merged horizontally
-
Enter the Number of assessors.
-
Select the Assessor labels.
-
Choose between Equal and User defined for Number of attributes per assessor.
-
Select the Product labels.
-
The computations begin once you have clicked on the OK button.
How to Interprete the Results of a Flash Profiling Analysis?
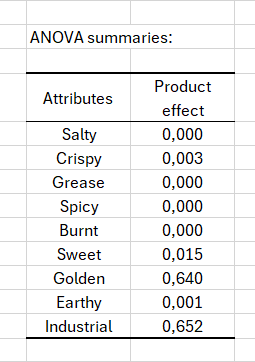
The first important result of the Flash profiling feature is the table summarising the ANOVAs for each attribute. In this table, we can see that for all the attributes except Golden and Industrial, the Product effect is significant at the 5% threshold which means that these attributes are discriminating.
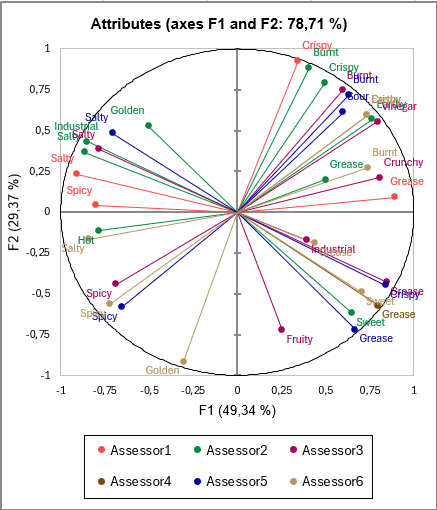
Next, we analyse the MFA results. First, we note that the first two MFA factors explain almost 80% of the variability in the dataset. On the circle of correlations between the variables, we can see that the Hot and Spicy variables are fairly correlated with each other. We can also see that the the first axis opposes the variables Spicy and Salty to Grease. The second axis appears to be fairly correlated with the Crispy and Burnt variables.
Finally, to conclude the analysis, we look at the chart of the products on the MFA axes with the aim of identifying the differences and similarities between the products. It should be noted that the products are quite far apart from each other, so the evaluators had to deal with fairly heterogeneous brands of chips. We note that Chips1 and Chips5 are particularly correlated with the first axis. Chips5 has the highest coordinate on the first axis which means that it has been identified as particularly greasy, whereas the opposite is true for Chips1 and therefore that it is saltier and spicier.
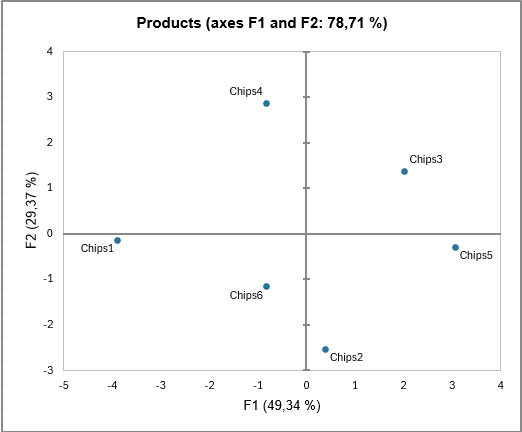
In conclusion, the use of the Flash profiling analysis on this example enabled us to not only characterize the different chip brands, but also to represent the chips and their attributes in two dimensions thus defining a sensory map.
Was this article useful?
- Yes
- No