STATIS analysis in Excel tutorial
This tutorial will show you how to run and interpret a STATIS analysis in Excel using the XLSTAT statistical software.
Dataset to perform a STATIS analysis
The data come from a projective mapping / Napping study carried out in Rennes by AGROCAMPUS OUEST. 8 smoothies were tasted by 24 subjects (panelists) and then placed on a tablecloth. The coordinates were collected for the STATIS analysis. If a panelist considers two products to be similar, the latter ones are placed closed by on the tablecloth so they have similar coordinates. The original file can be obtained with the R SensoMineR package.
The goal of this tutorial is to study and visualize the links between smoothies as well as to determine the agreements between the subjects.
What is the STATIS method?
The STATIS method is a multi-configuration data analysis commonly used in sensory analysis. The configurations represent the various assessors, subjects or judges. This method can be particularly used in the case of projective mapping / Napping, conventional profiling or free choice profiling. The great interest of STATIS is that atypical configurations have a smaller weight than the weigh of central configurations. The analysis, therefore, best reflects the general point of view and not those atypical configurations.
Setting up a STATIS analysis with XLSTAT
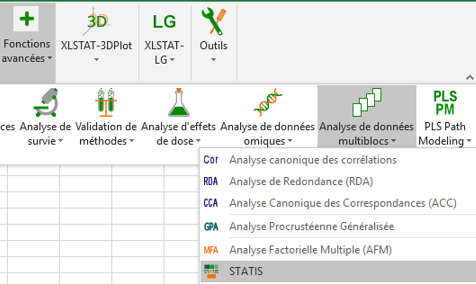
To activate the STATIS dialog box, start XLSTAT, and select the Advanced features/Sensory data analysis/STATIS.
 The STATIS dialog box will appear.
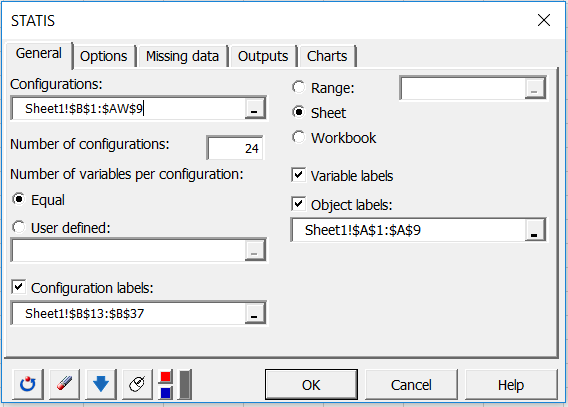
Select the data on the Excel sheet of the demo file that corresponds to the configurations (a configuration corresponds here to the set of coordinates given by a subject). Set the Number of configurations equal to 24 subjects.
As each configuration has 2 variables, we can let XLSTAT know that the number of variables is constant by selecting the Equal option. If the number of variables is different for a least one configuration, you need to select a column that contains the number of variables for each configuration.
Finally, activate the options Variable labels and the Object labels (in our case the smoothies).
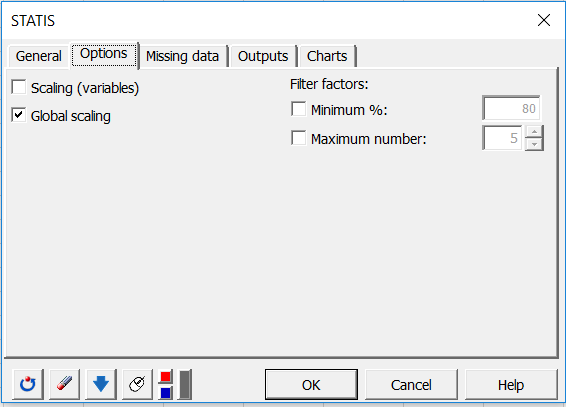
In the Options tab, we chose to globally reduce the configurations to avoid the scale effect. Since all the variables are on the same scale within each configuration, it is so not necessary to reduce the variables.
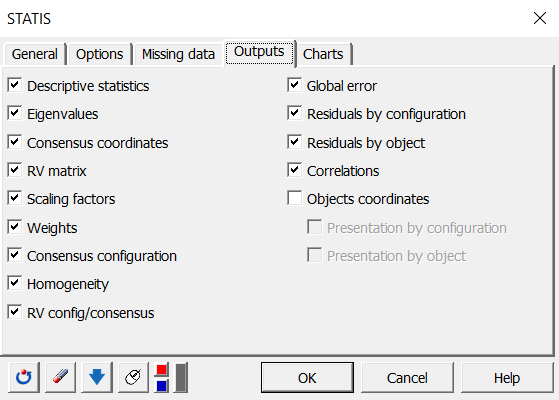
In the Outputs tab, we hose to display the RV matrix, as well as the RV among the configurations and the consensus to have indicators of proximity between the subjects.
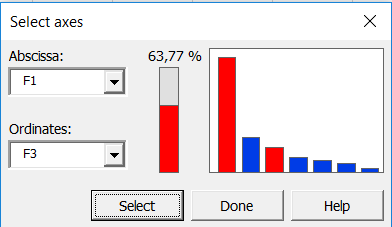
The computations begin once you have clicked on OK. Confirm the axes for which you want to display plots. In this example, the percentage of variability represented by the first two factors is not very high (68.43%); to avoid a misinterpretation of the results, we have decided to complement the results with a second chart on axes 1 and 3.

Interpreting the results of a STATIS analysis
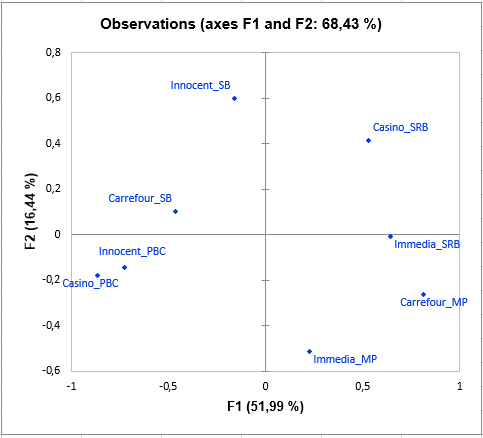
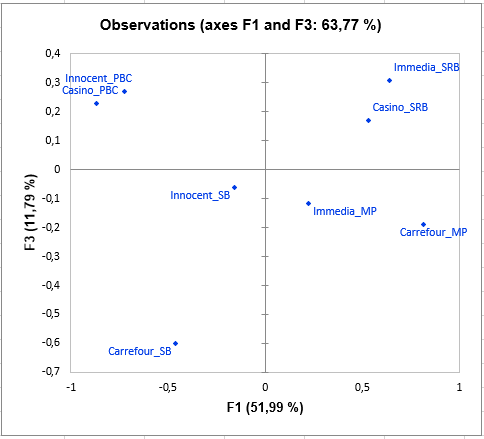
The following graph is the main objective of STATIS: to represent the observations on a 2-dimensional map, and thus to identify the proximities. For example, we see that "Casino_PBC" and "Innocent_PBC" smoothies are perceived as close, but they are very different from "Casino_SRB". On the third dimension, we can see that Carrefour_SB is totally opposed to "Casino_PBC", "Innocent_PBC", "Immedia_SRB" and "Casino_SRB".
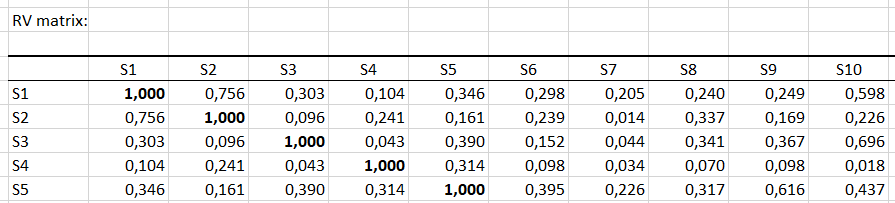
 If we are interested in two particular subjects (panelists), it is useful to look at the RV matrix which gives the coefficient RV among each subject (this coefficient is between 0 and 1, and increases with the proximity of the subjects). We see here that subject 1 has a very similar opinion about subject 2, but very different from subject 4 (which has low RV values with many other subjects here).
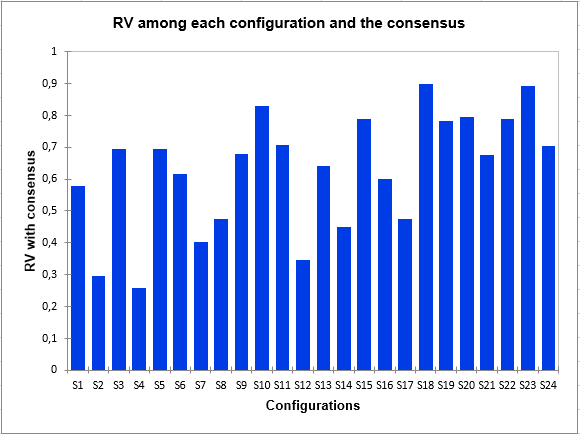
 It may be very important to assess the proximity of one subject to all the others, i.e. the overall point of view reflected by the consensus. Thus, the following bar chart shows that subject 4 is a rather atypical subject, unlike 18 or 23.
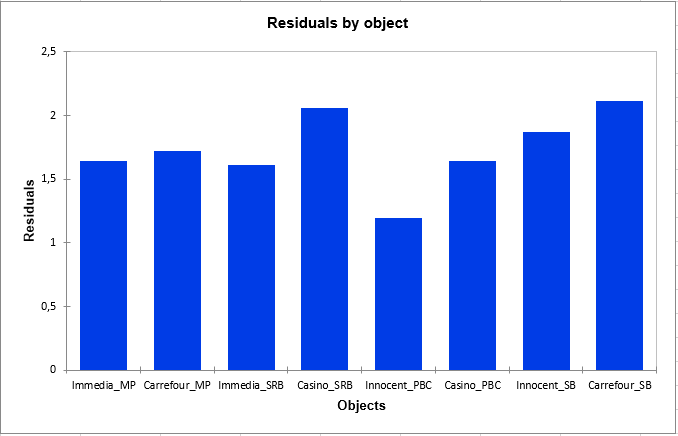
 Finally, the following graph gives the residuals by object, which indicates which objects were placed in the same way by the subjects, like the smoothie "Innocent_PBC", or rather differently, like the smoothie "Carrefour_SB".
Was this article useful?
- Yes
- No