Electre 1 multi-criteria decision analysis in Excel
This tutorial shows how to use and interpret an Electre 1 multi-criteria decision analysis in Excel using XLSTAT.
Dataset for running an Electre 1 analysis with XLSTAT
Six potential sites are evaluated for welcoming the construction of a brand new recycling center over five criteria: the noise that could be generated, the distance with the city, the pollution, the impact on the environment and the impact on recreations. The evaluation results are presented below:
 To allow variable contribution of the criteria in the decision-making process one could provide weights. The higher are the weights, the more important is the criterion.
 The goal of this tutorial is to identify the site or a set of sites that better fits the whole criteria for the construction of a new waste center. Data are fictitious and were created for this tutorial.
Setting up an Electre 1 analysis with XLSTAT
Once XLSTAT is open, select the XLSTAT / Advanced features/Decision aid/Multicriteria decision aid test command as shown below
 The multi-criteria decision aid test dialog box appears.
 In the General tab, select the data corresponding to the evaluation of the sites over criteria in the Performance matrix field. Then select the column that contains the Criteria weights in the field with the same name.
If necessary, modify the default values of the concordance and discordance thresholds to a value of your choice between 0 and 1. Finally, select the Sheet option in order to display the results on a new sheet and tick the Variable labels box to consider the first row of the data table as labels.
In the Outputs tab, activate the following options:
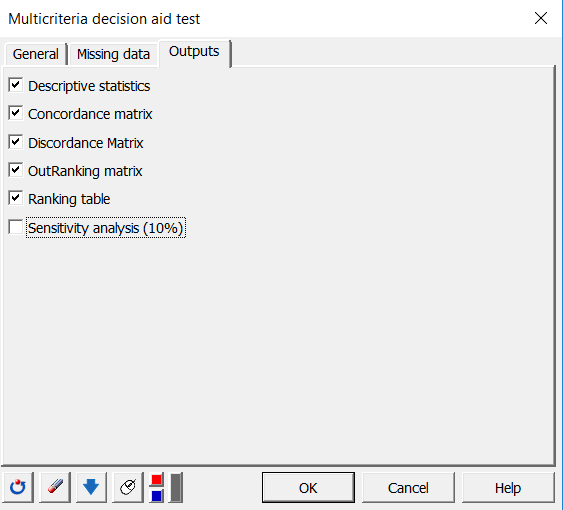 After you have clicked on the OK button, the computations start and the results are displayed on a new sheet named Electre 1.
Interpreting the results of an Electre 1 analysis
The first result is a full set of descriptive statistics given per sites. Then one could find the main matrices used in the computations, concordance and discordance matrices, followed by the outranking matrix shown below.
 In this example, only columns of sites 5 and 6 contain 1 on lines 4 and, 4 - 5, respectively, meaning that the site 5 over ranks the site 4 and the site 6 over ranks the sites 4 and 5. The 0 value means that there is no over ranking. To ease the interpretation of this matrix Xlstat proposes the Ranking table below:
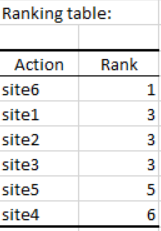 We may suggest that site 6 is then the best solution to our decision-making problem. Sites 1, 2 and 3 are ex aequo to the third place. Sites 5 and 4 are the lowest-ranked.
Going further with Electre 1 analysis
Electre 1 within XLSTAT offers the option to test the sensitivity of the final ranking to a variation of the concordance and discordance thresholds. To do this, you need to activate the output option sensitivity analysis (10%). This allows you to identify the minimum and maximum values of thresholds that keep the result unchanged and gain certitude in the final ranking. Here, for example, the result is unchanged with thresholds fixed to 1 (concordance) and 0 (discordance) but changes when you fix them to 1 and 0.3.
Was this article useful?
- Yes
- No