Building a decision tree in Excel, tutorial
This tutorial explains how to display and interpret a decision tree in Excel using XLSTAT.
Data set to display a decision tree
Click on the button at the beginning of the tutorial to download an Excel workbook with the decision tree built in this example.
Goal of this tutorial
The objective is to learn how to build a decision tree through a concrete example. A company, set to launch a new product on the market, wonders which advertising channel it should use. The decision tree, with its different nodes (or leaves) and branches, allows you to graphically visualize the different possible solutions and their potential results. We are going to use this tool to help the company in its decision making.
Building a decision tree with XLSTAT
- Launch XLSTAT, then select the Decision support/Decision tree command:

- In the General tab of the dialog box that appears, enter the name of the tree you want to build in the Name field. We want to maximize the company's gain, so we will enable the options Maximize Gain and Optimal Path for: Expected value.

- In the Options tab, enable the following options:

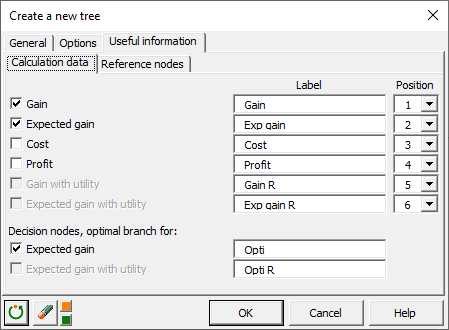
- In the Useful Information tab, we can choose the information to be displayed for each node of the tree. It is also possible to associate a label and a position to each piece of information, according to your preferences. Here is what we used in our example:
- Click on the OK button to validate the dialog box. The tree will be displayed in a new sheet.
![]()
- We will now add the first node. Click on the green triangle or right-click on the end node (right block) and select XLDTREE/Create New Node to open the Node Setup dialog box.

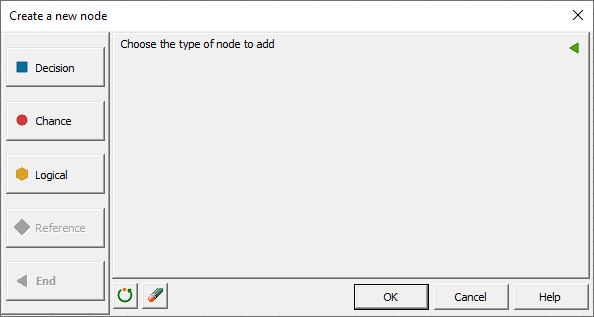
- Select Decision to create a first decision node with its various branches. Enter the name of the node in the Name field. By default, two branches are displayed in the dialog box. Add one using the
 button to the right of the list of branches. Select each branch one by one and update its information in the Selection section. Remember to validate each branch using the
  button.
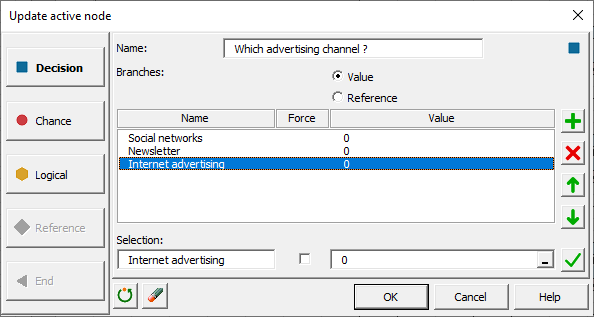
- Click the OK button to validate the dialog box and display the node you created.

- For each advertising channel or branch, we have to choose between using internal resources or using an external company. Click on the green triangle of the end node associated with the first branch or right-click on the end node block and select XLDTREE/Create New Node to open the Node Setup dialog box and fill in the necessary information.


-
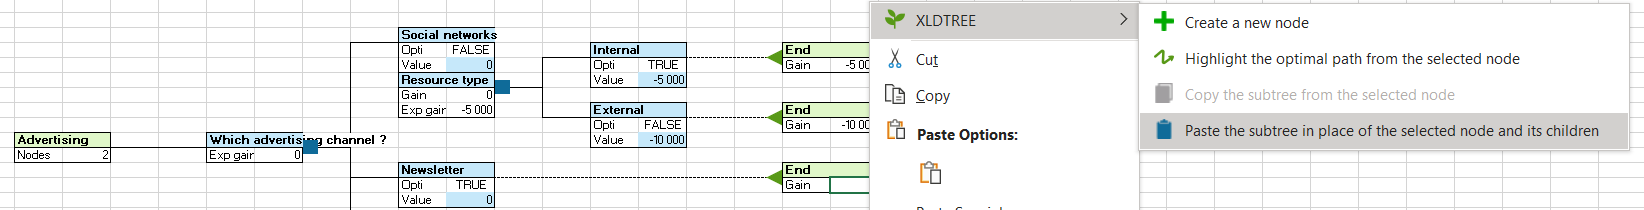
Right-click on one of the cells in the new node block. Select XLDTREE/Copy subtree from selected node.

-
Right-click on one of the cells in the second end node block. Select XLDTREE/Paste Subtree in place of the selected node and its children. Repeat for the last end node.
-
You can now fill in the correct values in the corresponding cells. The cells with a colored background can be modified directly in the Excel sheet. The cells containing calculation formulas will be updated automatically.

-
Each end node will now be replaced by a chance node whose branches describe the 2 hypotheses about the expected turnover (high or low). The same method as before is applied:
- At the first end node, click on the green triangle or right-click on the node block and select XLDTREE/Create New Node.
- Select the Chance type and fill in the necessary information.
- Copy the resulting node.
- Paste the node onto each of the other relevant end nodes.
- Enter the correct values directly in the cells of the Excel sheet.


Analyzing the results of the decision tree
Let's take the case of an investment in the development of a newsletter. We can observe the following figures:
- Using internal resources:
| Expected sales hypothesis | Probability | Expected profit by hypothesis | Expected profit weighted by hypothesis | Expected profit from the option | Cost of the option | Expected Gain |
|---|---|---|---|---|---|---|
| Haute | 40% | 18 000 | 7 200 (40% x 18 000) | 16 800 (7 200 + 9 600) | -3 500 | 13 300 (16 800 - 3 500) |
| Basse | 60% | 16 000 | 9 600 (60% x 16 000) |
- Using external resources:
| Expected sales hypothesis | Probability | Expected profit by hypothesis | Expected profit weighted by hypothesis | Expected profit from the option | Cost of the option | Expected Gain |
|---|---|---|---|---|---|---|
| Haute | 60% | 20 000 | 12 000 (60% x 20 000) | 18 400 (12 000 + 6 400) | -5 000 | 13 400 (18 400 - 5 000) |
| Basse | 40% | 16 000 | 6 400 (40% x 16 000) |
It therefore seems more interesting, in terms of revenue, to hire an external company to set up a newsletter. If we compare the expected gain from each advertising channel, then internet advertising would be the best choice. Such a decision should take other factors into account but these can easily be added to the tree to refine its analysis.
Go further
The different display options for a decision tree
In XLSTAT, you can choose the display mode for a decision tree as well as the different types of information to display. Check out this tutorial to see how to play with these options.
Methods for calculation and optimal path in a decision tree
In XLSTAT, different calculation modes are available to exploit a decision tree. You can also display the optimal path according to the objective (maximize or minimize the gain), for the whole tree or from a specific node. Check out this tutorial to learn more.
Was this article useful?
- Yes
- No