Customize a decision tree in Excel, tutorial
This tutorial explains how to configure the display of a decision tree in Excel using XLSTAT.
Dataset to configure the display of a decision tree
Click on the link above to download an Excel workbook with the decision tree used to configure the display.
Goal of this tutorial
The objective is to start with an existing decision tree and to learn how to configure its display. If you want to learn more about the construction of the tree, check out this tutorial.
Configuring the display of a decision tree with XLSTAT
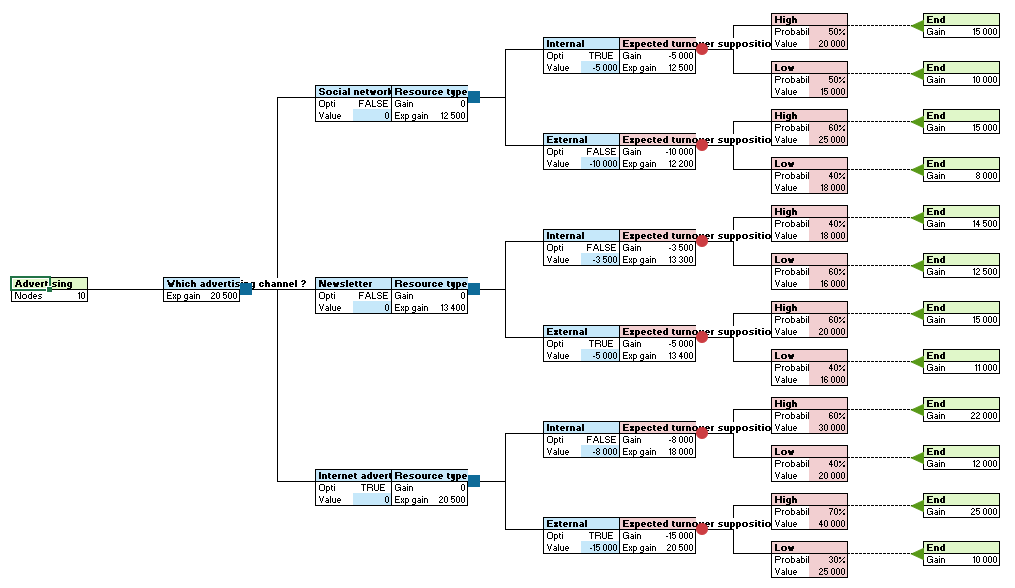
We start with an existing tree, provided in the dataset. In the decision tree toolbox, click on Remove Grid to improve the rendering. 
The tree is displayed horizontally. The branch blocks are positioned above the node blocks. You can modify this display as you wish. To do this, right-click on the tree block (first block on the left) and select XLDTREE/Open the settings dialog box for the selected tree. 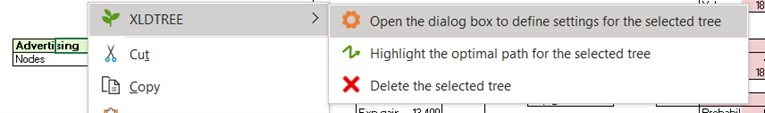
In the Options tab, you can change the display of the tree and branch/node blocks. Four possibilities are available. We will examine outcome of each one. You will be able to choose the visual that best suits your needs, knowing that this setting can be changed at any time. The active tree will be displayed as requested after you click the OK button.

- Tree display: Horizontal and Display of a branch / node block: Top / bottom: we get the display observed above.
- Tree display: Horizontal and Display of a branch / node block: Left / right:
- Tree display: Vertical and Display of a branch / node block: Top / bottom:

- Tree display: Vertical and Display of a branch / node block: Left / right:

In the Useful Information tab, you can choose what information to display for each node. You can assign a custom label to each node and choose their positions relative to each other. In the example below, we select the following:
- Position 1: Expected gain with label EG (The expected gain of a node depends on the gain of its children nodes. It will allow a decision to be made according to the chosen calculation mode).
- Position 2: Gain with label G (The gain of a node is the sum of its cost and profit. It is therefore calculated as a function of the costs and profits of its parent nodes. The cost is of course a negative value and the profit a positive value.)
- Position 3: Cost with label C (The cost of a node is the sum of all the costs of its parent nodes.)
- Position 4: Profit with label P (The profit of a node is the sum of all the profits of its parent nodes.)
 And here is the tree obtained with a vertical display and the branch blocks above the node blocks:

Go further
Methods for calculation and optimal path in a decision tree
In XLSTAT, different calculation modes are available to exploit a decision tree. You can also display the optimal path according to the objective (maximize or minimize the gain), for the whole tree or from a specific node. Go this tutorial to learn more.
Was this article useful?
- Yes
- No