Analytic Hierarchy Process (AHP) in Excel, tutorial
This tutorial shows how to configure an Analytic Hierarchy Process (AHP) and how to interpret the results using XLSTAT in Excel.
What is Analytic Hierarchy Process (AHP)?
AHP is a decision aid method based on a criteria hierarchization. It is better adapted when the criteria number remains reasonable, and when the user is able to evaluate 2 by 2 the elements of his problem. The AHP feature proposed in XLSTAT has the advantage of not having any limitations on the number of criteria, of subcriteria and of alternatives and allows the participation of a large number of evaluators.
Dataset to use in an AHP analysis
The data correspond to the parameters of a decision problem about the purchase of a new car. We have 3 evaluators named Steeve, Owen, and Jack who participate in the decision making. The criteria are the cost, safety, capacity and style of the car. The criterion cost is divided into subcriteria which are the purchase price, the fuel cost, the maintenance, and resale. The criterion capacity includes 2 subcriteria which are the number of passengers and the capacity of cargo. Six car models are evaluated using all criteria and subcriteria. The solutions to the problem are called alternatives. The data is grouped in a table as follows:
 The goal of this tutorial is to find which car is the best choice according to the opinions of the three evaluators.
Setting up an AHP analysis with XLSTAT
Step 1: Generate the AHP design
The first step is to generate a design of experiment with the DHP tool. Launch XLSTAT and click on the menu XLSTAT / Advanced features / Decision aid / DHP:
 The dialog box Designs for AHP analysis appears.
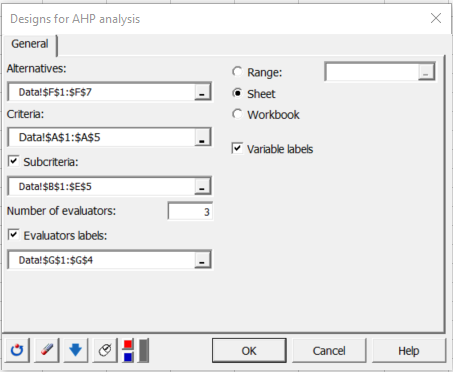 In the General tab, select the car list (Datasheet of the demo Excel file) in the Alternatives field.
Then select the column that contains the criteria in the field with the same name, the 4 subcriteria columns in the respective field and finally the column that contains in the field Evaluators labels.
In the General tab, select the car list (Datasheet of the demo Excel file) in the Alternatives field.
Then select the column that contains the criteria in the field with the same name, the 4 subcriteria columns in the respective field and finally the column that contains in the field Evaluators labels.
After clicking the OK button, the design of the experiment is generated and displayed in a new sheet named AHP design. The data summary table, the Saaty table and the instructions for filling in the comparison tables of the design are displayed in the output sheet.
The Saaty table provides the values to be used by the 3 evaluators in order to fill in the comparison tables. Below is an example of filling in the criteria comparison table by the evaluator Owen.
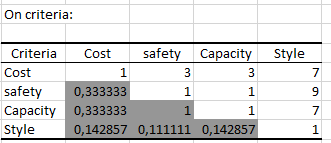 For example, Owen has evaluated the cost versus the style at 7. According to the Saaty scale, this means that the cost is judged to be very important compared to the style criterion.
Step 2: Run the AHP analysis
Once all the tables are completed, click on the XLSTAT / Advanced features / Decision aid / AHP menu to open the AHP Method dialog box or click on Run the analysis button situated below the design table.
In the General tab, choose a worksheet that contains a DHP design generated by XLSTAT, here AHP design.
 After clicking the OK button, the computations start and the results are displayed in a new sheet named AHP.
Interpreting the results of an AHP analysis
The first results are tables and graphs presenting the mean values of the results obtained by the evaluator. Below are presented tables and graphs of the results obtained for each evaluator.
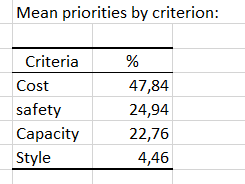
The results are given by a table on criteria, one or more tables on subcriteria and a table on the alternatives. If the graphical option is enabled, the results are also displayed as bar charts.
In this example, it is the cost criterion that impacts the most the decision making, and in particular the subcriterion purchase price.
 Based on these priorities, it is the car Element which seems to answer the problem.
 However, by taking into account all the criteria, we suggest that the car Odyssey could be the best choice (summing the weights of the criteria for each car model).
Going further with AHP analysis
The XLSTAT AHP feature offers the possibility to test the data consistency by calculating two parameters: the index of coherence and the ratio of coherence. This test allows checking the inconsistencies which could be entered in the comparison tables. For example, if the ratio of coherence is greater than 10% then it is recommended to review the evaluation of the comparison table concerned.
Was this article useful?
- Yes
- No