Levene and Bartlett tests on variances in Excel
This tutorial will help you compare several observed variances using Levene’s and Bartlett’s tests, in Excel with the XLSTAT software.
Not sure this is the statistical test you are looking for? Check out this guide.
Dataset for the Levene and Bartlett tests for the comparison of variances
The data are extracted from the Iris example, used in several of our tutorials [Fisher M. (1936), The Use of Multiple Measurements in Taxonomic Problems. Annals of Eugenics, 7, 179 -188] and correspond to 150 Iris flowers, described by their petal width and the corresponding species.
Three different species have been included in this study: setosa, versicolor and virginica.
Our goal is to test if variance of the petal width is identical across species or not.
The same data are displayed in two alternative formats accepted by XLSTAT: either you have one column with the petal widths, and one column with the species, or you can split the data into three columns, one per species.
Setting up a test comparing variance: Levene and Bartlett tests
After opening XLSTAT, select the XLSTAT / Parametric test / k-sample comparison of variances, or click on the corresponding button of the Parametric tests toolbar (see below).

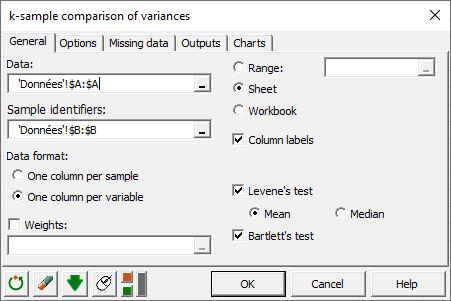
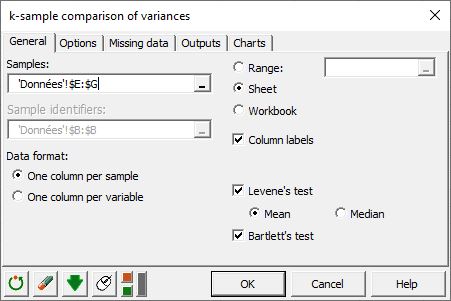
Once you've clicked on the button, a dialog box appears. XLSTAT offers two formats to select the data. Either all the numerical data are in one column, and a second column corresponds to the sample descritors, or you have the different samples split into as many columns as there are samples.
The first dialog box displayed below corresponds to the case where you have one column with all the petal widths and one column with the corresponding species.
The second dialog box displayed below corresponds to the case where you have one column for each species.
There are two possibilities for the Levene's test, one based on the mean and the second on the median. While they often give very close results, the one based on the median is usually recommended.
The computations begin once you have clicked on OK. The results will then be displayed.
Results of a test comparing variance - Levene and Bartlett tests
The first results displayed are the descriptive statistics for the various samples. Then the results of the tests are displayed.

The two tests agree that one should reject the null hypothesis that the variance of the petal widths is identical for the three samples.
Was this article useful?
- Yes
- No