One proportion test in Excel tutorial
This tutorial shows how to test the difference between an observed proportion and a theoretical one, using the one proportion test, in Excel with XLSTAT.
Dataset for comparing one proportion to a value
The data are the results of the launch of a coin 30 times. We would like to assess if the coin is biased or not so we want to compare the results to the proportion 0.5 so half of the time a tail, half of the time a head.
Setting up a test for comparing one proportion to a value
To start the proportion test go to the menu Parametric test / Tests for one proportion.

In the General tab, fill in the following information:
-
Frequency: 19
-
Sample size: 30
-
Test proportion: 0.5
-
Data format: Frequency
Select the option z test and go to the next tab.
 !
!
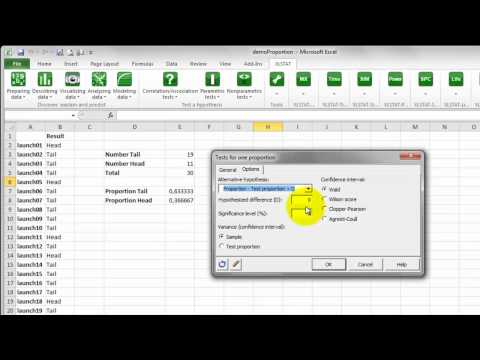
As an alternative hypothesis choose the option Proportion – Test proportion > D as 19 is bigger than the expected frequency of 15. The default significance level is left as is: 5%.
The Variance (confidence interval) which is an option that appears only whan using the Wald confidence interval should be set to Test proportion as we want to calculate the confidence interval on the 0.5 proportion.

When ready, click on OK.
Results of a test for comparing one proportion to a value
The result is that as the p-value for this test is 0.072 which is superior to the 0.05 limit, the null hypothesis should be accepted and the difference between the proportions is equal to 0. This means that the coin is not biased.

The following video demonstrates how to run a proportion test on one proportion in XLSTAT.
Was this article useful?
- Yes
- No