Compare two proportions in Excel tutorial
This tutorial shows how to compute and interpret an two proportions analysis in Excel using the XLSTAT software. Not sure this is the statistical test you are looking for? Check out this guide.
Dataset for comparing two proportions
We are going to compare the proportion of male and female that are public relation managers per earning category in the US (Source: US Census Bureau, Census 2000 special tabulation).
As can be seen in the dataset, the distribution is very different between male and female.
The earning strata that seems to be the most similar between gender is a yearly salary of $50,000 to $74,999: 29.32% of the male and 25.00% of the female PR manager are earning this salary.
We are now going to test the following null hypothesis H0: There is no gender difference in the proportion of people earning $50,000 to $74,999. The alternative hypothesis will be Ha: There is a bigger proportion of male managers earning $50,000 to $74,999 than female managers.
Setting up a test for comparing two proportions
Go to the menu Parametric tests / Tests for two proportions.

Once the dialog box is opened, fill in the following information:
- Frequency 1: 8990 (Female PR managers earning $50,000 to $74,999)
- Sample size 1: 35955 (Total Female PR managers)
- Frequency 2: 6619 (Male PR managers earning $50,000 to $74,999)
- Sample size 2: 27340 (Total Male PR managers)
The Data format is Frequencies.
We select a z test rather than a Monte Carlo method as we do not need to use Monte Carlo simulation.
Leave the default value Sheet to display the results in a new sheet of the current workbook.

Move on to the next tab: Options.
For the Alternative hypothesis set up the option Proportion 1 –Proportion 2 < D where D is 0, as the proportion of female PR manager earning $50,000 to $74,999 is inferior to the same proportion for male.
Keep the significance level to 5%.
There are two different formula to compute the variance we will use the first one.

Click on OK.
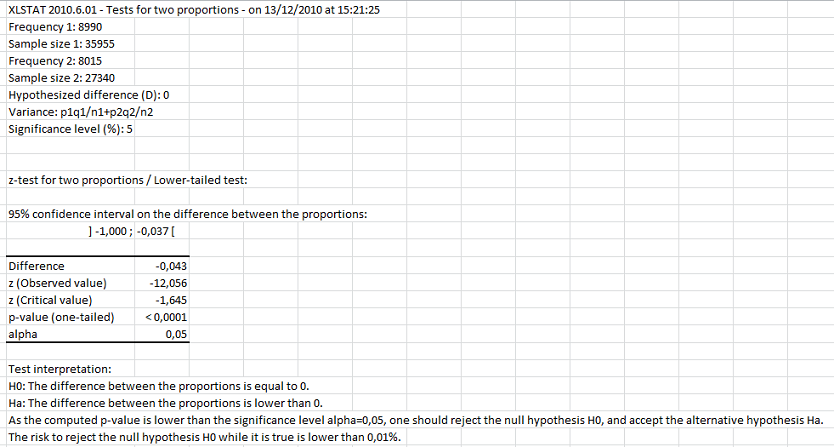
Interpreting the results of a test comparing two proportions
In the result sheet look at the value of the p-value. It is inferior to the limit of 0.05 therefore we should reject the hypothesis and conclude that the proportion of female PR manager earning $50,000 to $74,999 is significantly less than the proportion of male PR manager.
Was this article useful?
- Yes
- No