Student's t test on two independent samples tutorial
This tutorial will help you compare two observed means (this guide).
Dataset to run a Student's t test on two independent samples
The data are from [Fisher M. (1936), The Use of Multiple Measurements in Taxonomic Problems. Annals of Eugenics, 7, 179 -188] and correspond to 100 Iris flowers, described by four variables (sepal length, sepal width, petal length, petal width) and their species. The original dataset contains 150 flowers and 3 species, but we have isolated for this tutorials the observations belonging to the versicolor and virginica species. Our goal is to test if for the four variables, there is a clear dfference between the two species.


Iris versicolor and virginica.
Setting up a Student's t test on two independent samples
After opening XLSTAT, select the XLSTAT / Parametric tests / Two-sample t and z-test command, or click on the corresponding button of the Parametric tests toolbar (see below).

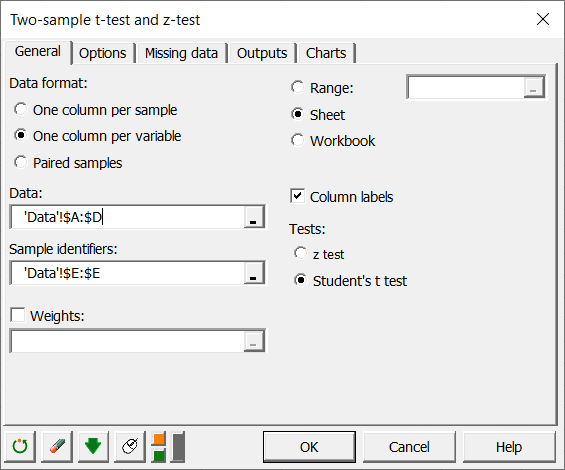
Once you've clicked on the button, the dialog box appears.
The format of the dataset is such that you have one variable per column.
If we were running the test for one variable only (out of the four), we could also have one column for each specie. The third format is for paired samples (in that case, there must be one column per sample).
We choose to run only the t-test.
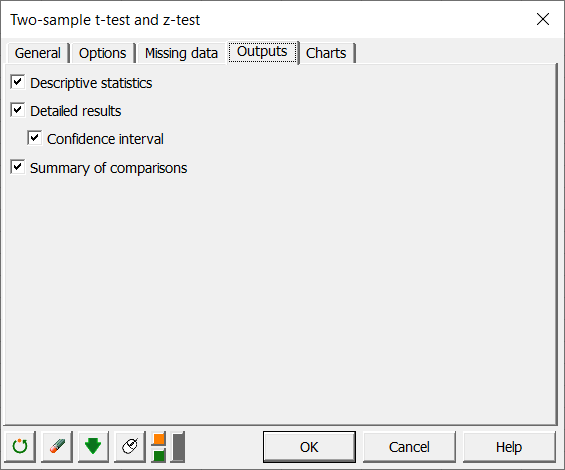
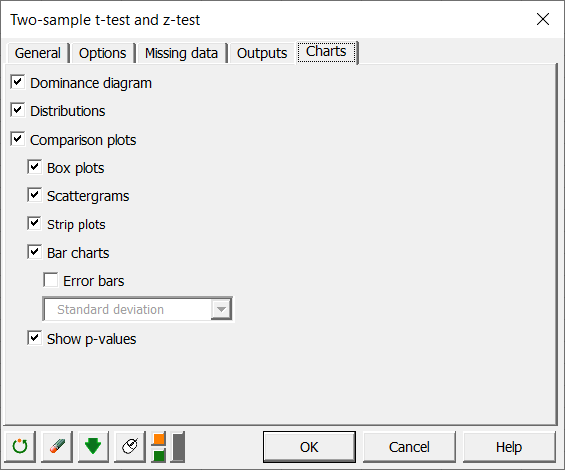
In the Options tab, we leave the default options. In the Charts tab, we activate the option for the dominance diagram.

The computations begin once you have clicked on OK. The results will then be displayed in a new sheet.
Interpreting the results of a Student's t test on two independent samples
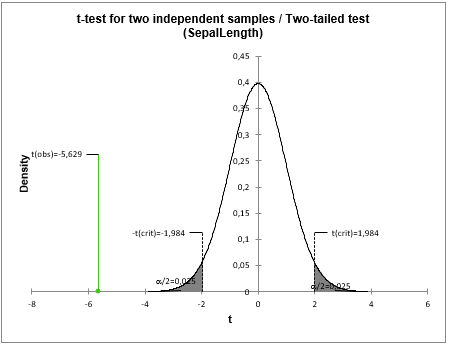
The first results displayed in the XLSTAT report sheet are the summary statistics for each sample followed by the t-test outcome, the distribution graph as well as the comparison plots.
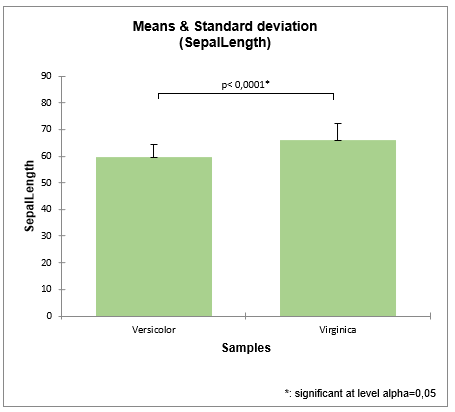
The results for the SepalLength variables are displayed below.

 The comparison plots below summarize in a single graph (e.g. boxplot, scattergram) the t-test results. Hence, we can visualize at the same time the distribution of each sample but also verify the significance of their difference (p-value).

Was this article useful?
- Yes
- No