Mann-Kendall trend test in Excel tutorial
This tutorial will help you compute run and interpret a Mann-Kendall trend test on a time series in Excel using XLSTAT.
Dataset to perform a Mann-Kendall trend test
The data have been obtained in [Box, G.E.P. and Jenkins, G.M. (1976). Time Series Analysis: Forecasting and Control. Holden-Day, San Francisco], and correspond to monthly international airline passengers (in thousands) from January 1949 to December 1960. It is widely used as a nonstationary seasonal time series. Our goal is to test whether there is a trend in the time series.

Setting up a Mann-Kendall trend test with XLSTAT
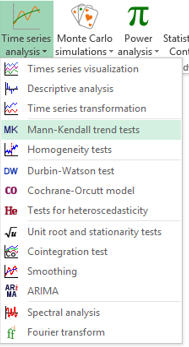
After opening XLSTAT, select the Mann-Kendall trend tests under the Time series analysis menu.
The Mann-Kendall dialog box appears.
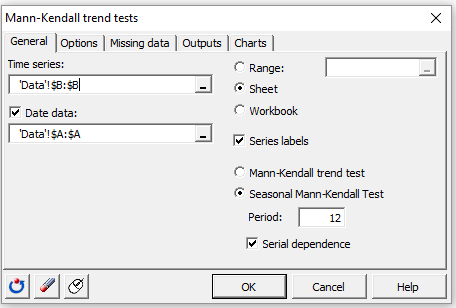 Using the demo file, select column B (Passengers) in the Time series field and column A (Month) in the Date data field. As we selected the column headers, we leave the option Series labels activated.
XLSTAT offers two tests: the classical Mann-Kendall test to test if there is a trend in the time series; the seasonal Mann-Kendall test that takes into account the seasonality in the time series (here 12 months).
Here, we will show how to apply the second one, so we activate the Seasonal Mann-Kendall option and enter 12 (=months) in the Period field (period = number of lags between two seasons). To calculate the p-value of this test, XLSTAT uses a normal approximation to estimate the distribution of the average Kendall tau. A continuity correction can be also applied if selected by the user.
Let's assume that the series are dependent (eg values of January and February are dependent). We, therefore, we activate the option Serial dependence.
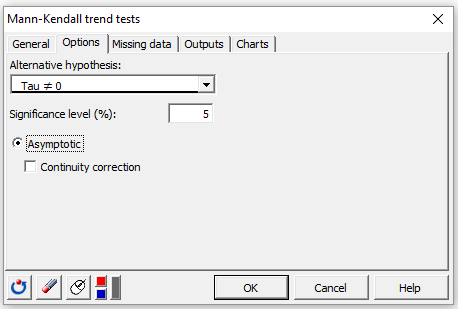
In the Options tab, we select tau<>0 as an alternative hypothesis.
Once you have clicked the OK button, the computation starts. The results are then displayed.
Interpreting the results of a Mann-Kendall test
The first output displays the descriptive statistics of the series followed by results of the test. In this example, we consider the fact that our time series are characterized by a seasonality of 12 months. The seasonal Mann-Kendall test will tell us whether there is a trend not due to seasonality. 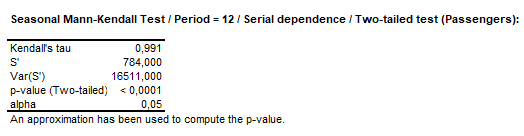 The p-value (<0,0001) shows that the null hypothesis is rejected thus we may suggest that there is a significant trend in our time series when we take into account the 12-month seasonality.
Was this article useful?
- Yes
- No