Random Forest regression in Excel tutorial
This tutorial will help you set up and train a random forest regressor in Excel using the XLSTAT statistical software.
Dataset for running a random forest regression
The dataset used in this tutorial is extracted from the Machine Learning competition entitled "Titanic: Machine Learning from Disaster" on Kaggle the famous data science platform. The Titanic dataset can be accessed at this address. It refers to the ocean liner the Titanic that sunk in 1912. During this tragedy, more than 1,500 of the 2,224 passengers lost their lives due to an insufficient number of lifeboats.
The dataset is made up of a list of 1309 passengers and their characteristics: - survived: Survival (0 = No; 1 = Yes)
- pclass: Passenger Class (1 = 1st; 2 = 2nd; 3 = 3rd)
- name: Name
- sex: Gender (male; female)
- age: Age
- sibsp: Number of Siblings/Spouses Aboard
- parch: Number of Parents/Children Aboard
- fare: Passenger Fare
- cabin: Cabin
- embarked: Port of Embarkation (C = Cherbourg; Q = Queenstown; S = Southampton)
The goal of this tutorial is to set up and train a Random Forest regressor (RDF) on the Titanic dataset.
Setting up a Random Forest Regressor in XLSTAT
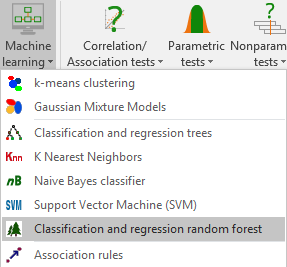
Once XLSTAT is open, click on Machine Learning / Classification and Regression Random Forest as shown below:
 The RDF dialog box appears.
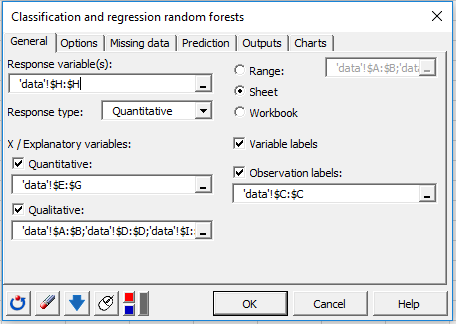 In the General tab, select the data in the different fields as shown above. In the Response type field, select the type of variable you want to predict (here Quantitative). In our case, this is the column giving the Passenger’s fare information.
Select the Variable labels to take into account the variables names provided in the first row if the data set. Finally, select the passengers’ names as the Observation labels.
In the General tab, select the data in the different fields as shown above. In the Response type field, select the type of variable you want to predict (here Quantitative). In our case, this is the column giving the Passenger’s fare information.
Select the Variable labels to take into account the variables names provided in the first row if the data set. Finally, select the passengers’ names as the Observation labels.
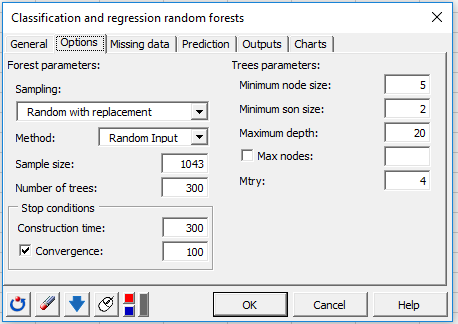 In the Options tab, several parameters will allow us to better control the way Trees are built. Activate the convergence option and set it to 100 so that XLSTAT can check every 100 trees if the algorithm converges and therefore if the OOB error stabilizes.
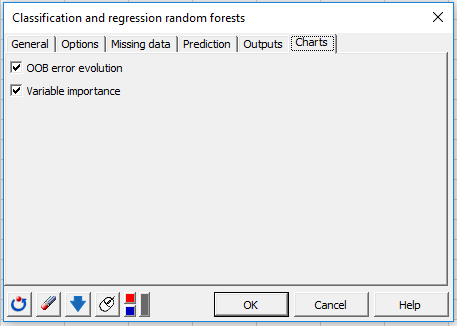
Finally, configure the Outputs and Charts tab as follows: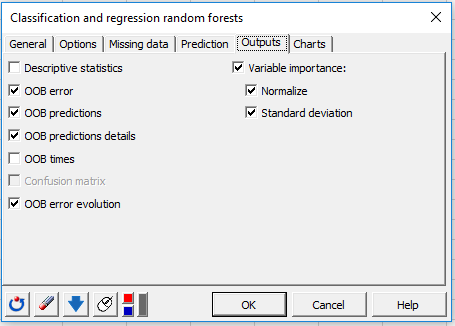
 The computations begin once you have clicked on the OK button.
Interpreting the results of a Random Forest Regressor
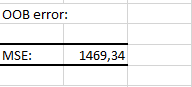
The first result displayed is the OOB error. This error corresponds to the average prediction error committed on each OOB sample of the learning set.
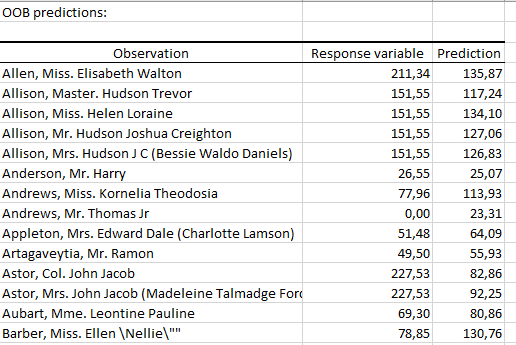
 The following table displays the response and the predicted value related to each observation of the learning set (prediction made using only the trees in which they are OOB).
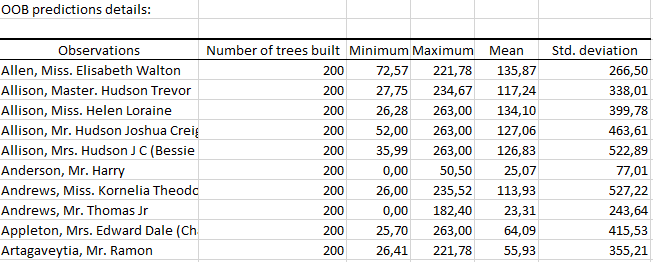
 The second table displays for each observation of the learning set, we have the minimum, maximum, mean and standard deviation of the values predicted by all the trees in which the observation is OOB.
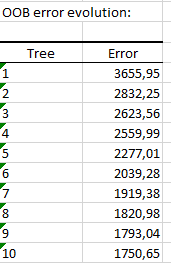
 The following table displays the evolution of the OOB error according to the number of trees. The row i of the table correspond to the OOB error committed by taking into account all the trees up to the i-th .
 The graph below summarizes the information of the previous table.
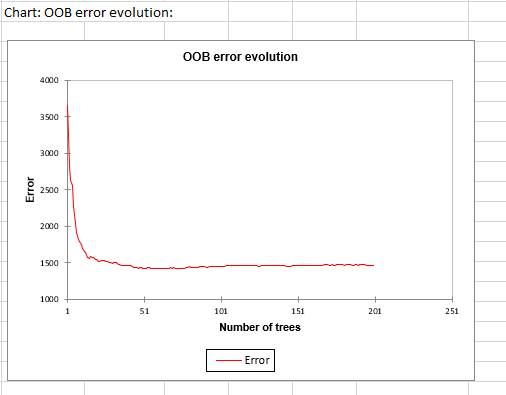 We notice that the OOB error quickly decreases and stabilizes. As we check every 100 trees the convergence, the algorithm stops at 200 trees built since the OOB error no longer varies.
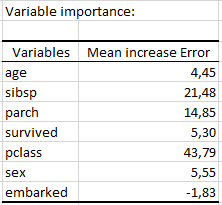
The next table contains, for each variable, its normalized variable importance measure (Normalization by the standard deviation).
We notice that the OOB error quickly decreases and stabilizes. As we check every 100 trees the convergence, the algorithm stops at 200 trees built since the OOB error no longer varies.
The next table contains, for each variable, its normalized variable importance measure (Normalization by the standard deviation).
 A graphical representation of the above table is given below:
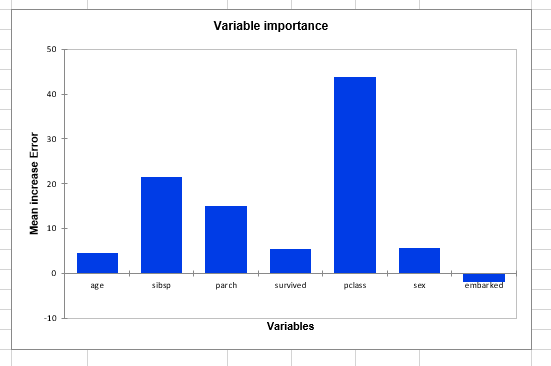 As we can see, the most important variable is the passenger’s class information. Therefore, we may suggest that there is a link between the fare and the passenger’s class.
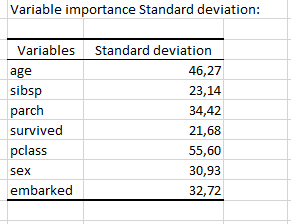
For each variable the standard deviation of its variable importance measure is also displayed:
Going further: Random Forest Classification on Titanic dataset
See here how you can set up and train a Random Forest classifier on the Titanic dataset in order to predict passengers class.
¿Ha sido útil este artículo?
- Sí
- No