Multiple Factor Analysis (MFA) on frequency tables in Excel
This tutorial will help you set up and interpret a Multiple Factor Analysis (MFA) for frequency tables in Excel using the XLSTAT statistical software.
Multiple Factor Analysis (MFA) is useful to simultaneously analyze several tables of variables and to obtain results, particularly charts, that allow to study the relationship between the observations, the variables and the tables.We focus here on the particular case of the MFA for frequency tables. For a more general description of the MFA and are used on other types of tables, you can refer to this tutorial.
The methodology of the Multiple Factor Analysis for frequency tables breaks up into two phases:
- We successively run for each table a Correspondence Analysis (CA). One stores the value of the first eigenvalue of each analysis to then weigh the various tables in the second part of the analysis.
- One carries out a weighted PCA on the columns of all the tables. The weighting of the tables makes it possible to prevent that the tables that include more variables do not weigh too much in the analysis.
Dataset for running a Multiple Factor Analysis for frequency tables
The data used in this tutorial have been collected by LAURIE E. FRIDAY., and used in the following article: [Friday, L.E. (1987) The diversity of macroinvertebrate and macrophyte communities in ponds, Freshwater Biology, 18, 87–104.].
These data correspond to a counting of species classified into different groups (tables) on various sites. We have 62 species divided into 5 groups and the measures of counting were made on 12 different sites, the species are divided in the following way:
- Table 1 contains 6 species belonging to the group Oligochaeta.
- Table 2 contains 13 species belonging to the group Coleoptera.
- Table 3 contains 13 species belonging to the group Trichoptera.
- Table 4 contains 8 species belonging to the group Mollusca.
- Table 5 contains 22 species belonging to the group Diptera.
Setting up a Multiple Factor Analysis in XLSTAT
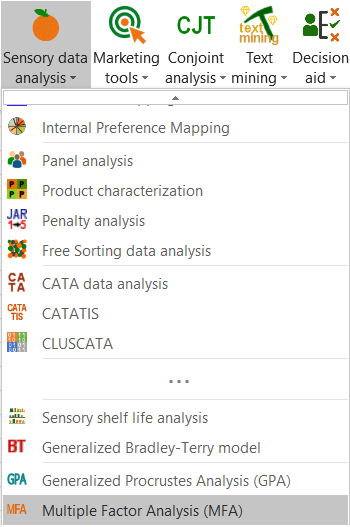
Once XLSTAT is open, select the Advanced Features / Multiblock data analysis / Multiple Factor Analysis (MFA) command in the XLSTAT menu. Note that MFA is also available under the Sensory data analysis menu.
 Once you have clicked on the button, the MFA dialog box appears.
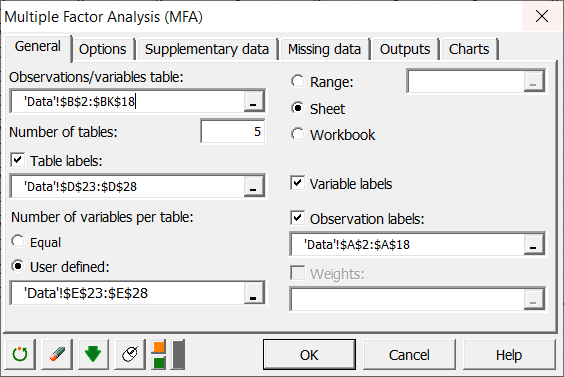 Select the data in the demo file that correspond to all the variables of interest. As we saw above, the variables can be grouped into 5 different tables.
We need to specify that the number of tables is 5. We then select the names we have given to the 5 tables (Oligochaeta, Coleoptera, Trichoptera, Mollusca et Diptera).
Finally, we define the number of variables within each table. As the number is not the same for all the tables, we select a range on the Excel sheet that contains the number of variables within each table.
As the column headers are available in all the selections, we activate the option Variable labels.
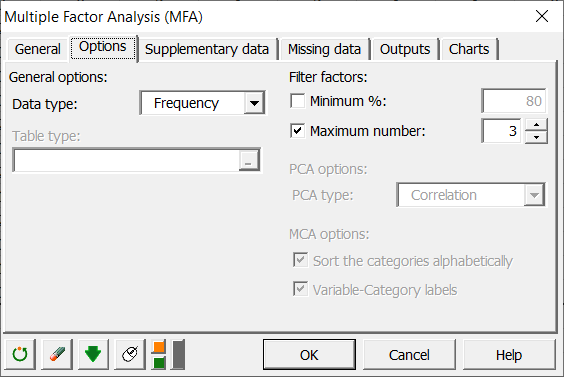
In the Options tab, select the frequency data type as we are using frequency tables corresponding to count data of species.
Select the data in the demo file that correspond to all the variables of interest. As we saw above, the variables can be grouped into 5 different tables.
We need to specify that the number of tables is 5. We then select the names we have given to the 5 tables (Oligochaeta, Coleoptera, Trichoptera, Mollusca et Diptera).
Finally, we define the number of variables within each table. As the number is not the same for all the tables, we select a range on the Excel sheet that contains the number of variables within each table.
As the column headers are available in all the selections, we activate the option Variable labels.
In the Options tab, select the frequency data type as we are using frequency tables corresponding to count data of species.
 After you have clicked on the OK button, the computations start and the results are displayed on a new Excel sheet.
Interpreting the results of a Multiple Factor Analysis for frequency tables
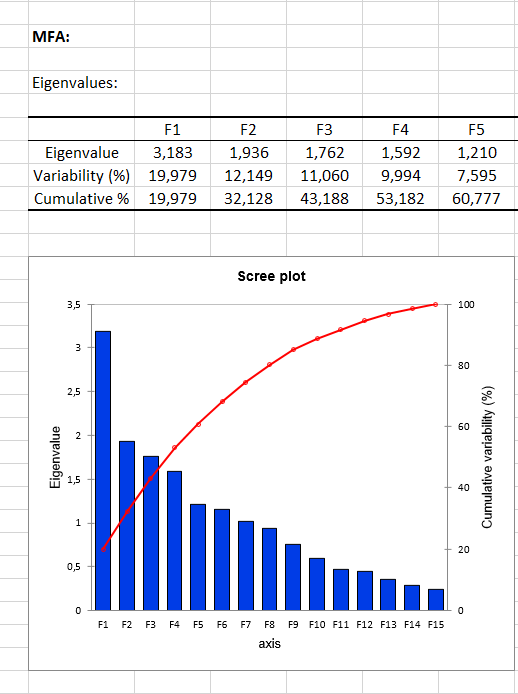
The first set of results corresponds to the descriptive statistics of the various variables followed by separate analyses are run on each table. Because every table is a frequency table, a Correspondence Analysis (CA) is performed on each of them. The results of these preliminary analyses are then used in the final analysis, the second phase of the Multiple Factor Analysis, which is, in fact, a weighted PCA (the weights are set on the columns). The results of the MFA start with the analysis of the eigenvalues of the weighted PCA.
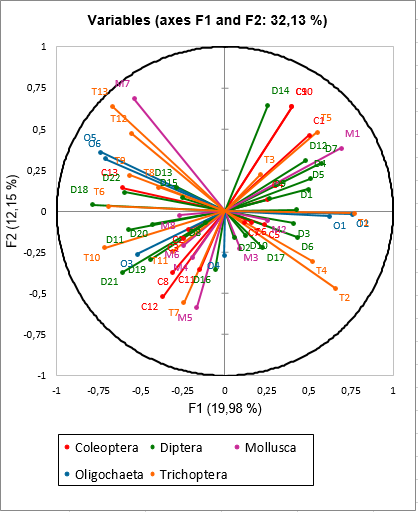
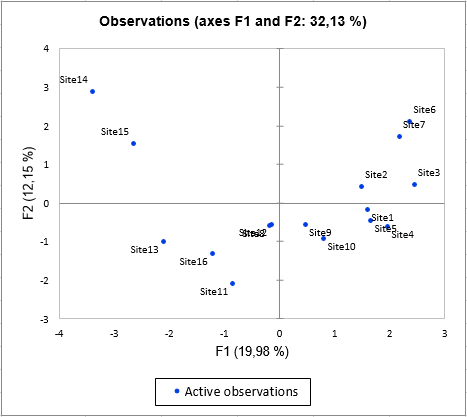
 The first results concern variables (colored according to their group) and the observations as in a classic PCA.
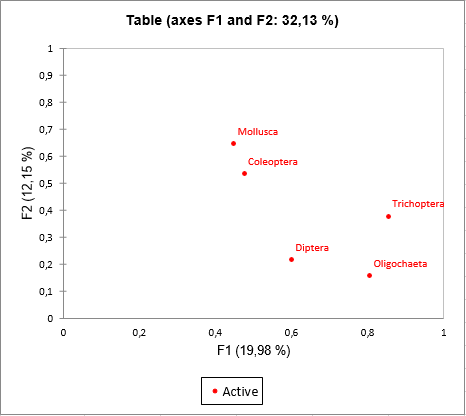
 The results specific to MFA are then displayed. First of all, the table coordinates are displayed and used to create the graph of tables. We can see on the graph that the first axis is strongly linked to tables Trichoptera and Oligochaerta while the axis 2 is linked to tables Mollusca and Coleopteras.
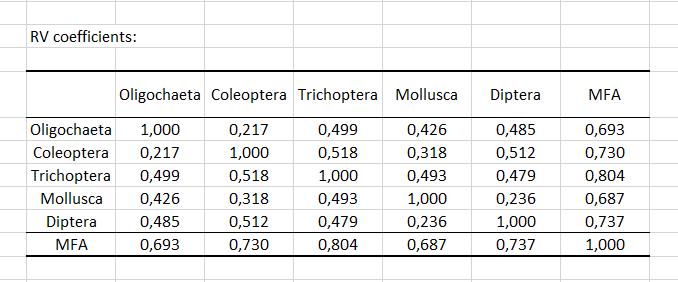
 The Lg coefficients of the relationship between the tables allow to measure to what extent the tables are related two by two. The RV coefficients (see below) of the relationship between the tables are another measure derived from the Lg coefficients. The value of the RV coefficients varies between 0 and 1, which make them easier to analyze. We can see here that the two closest tables are the taste and the olfaction after shaking. More surprisingly, we see that the RV coefficient between Diptera and Coleoptera is the highest.
 The specific following result in MFA corresponds to the analysis of the partial axes. The graph of the partial axes allows to see which axes (factors) of every separate analysis are correlated to axes produced by MFA. We see for example that the axis 1 of CA of the table Oligochaeta and the axis 1 of CA of the table Trichoptera are strongly negatively correlated to the axis 1 of MFA.
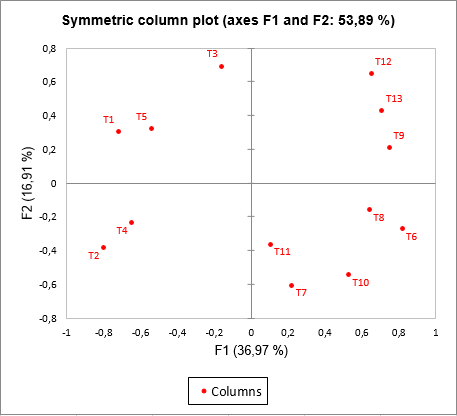
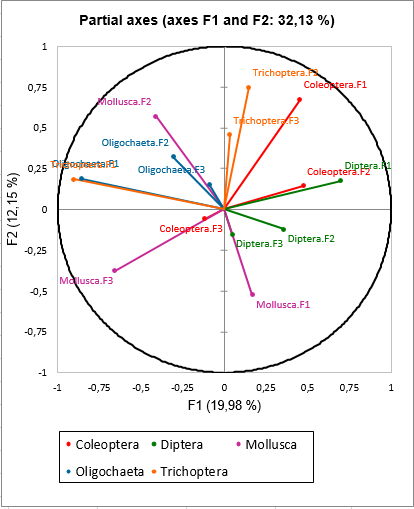 If we look more precisely at the separate results in particular at the variable coordinates of the CA of the table Trichoptera (row 517 of the results sheet), we notice that negative values on the first axis of this CA correspond to important frequencies of the species T1, T2, T3, T4 and T5.
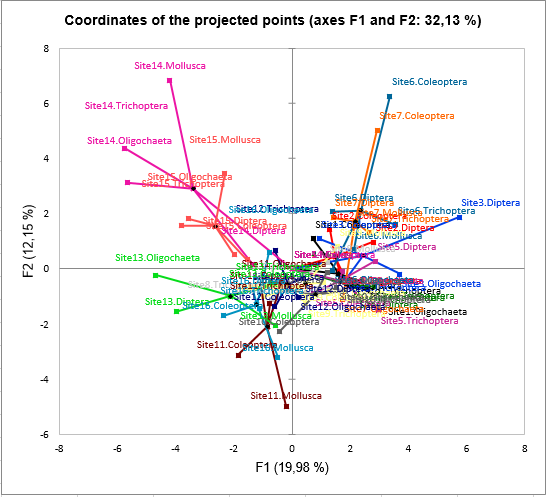
 The last chart specific to MFA is based on the observations chart with the projected points being added to the observations, and lines being drawn between the observation and the corresponding projected points. The projected points correspond to supplementary observations for which only the information provided by one table is taken into account, the other tables being transformed to 0s. This allows to see how the different tables influence the position of a given point. For example, for the site 14, we see that the table Mollusca tend to make this site even more different from the others, this is also for the site 11 and the table Mollusca at the bottom of the chart.
 As a conclusion, Multiple Factor Analysis is an interesting and rich method because it makes it possible to analyze complex data sets, and provides many graphical results: we can visualize tables (in which variables are grouped), the variables themselves, and the observations. In this particular example, it allowed us to quickly position the sites on a map while being able to quickly interpret their position.
War dieser Artikel nützlich?
- Ja
- Nein