Analysis of Liking data with Excel
This tutorial shows how to compute and interpret a liking data analysis in Excel using the XLSTAT software.
Dataset to run a liking data analysis in XLSTAT
The data comes from a preference study of 5 varieties of apples which were evaluated by 119 consumers.
Goal of this tutorial
The goal of this tutorial is:
-
to determine which apple varieties are the most popular.
-
to compare the apple varieties two by two.
-
to determine if the subjects agree
We will use the Liking data analysis feature of XLSTAT to perform this analysis. This tool will allow us to achieve the three goals defined above.
Setting up a liking data analysis in XLSTAT
Select the XLSTAT / Advanced features/ Sensory data analysis/ liking data analysis command (see below).
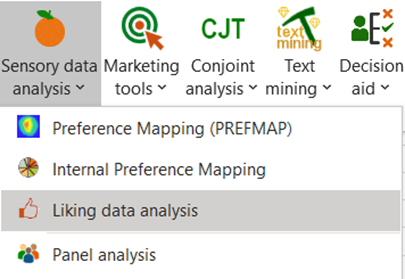
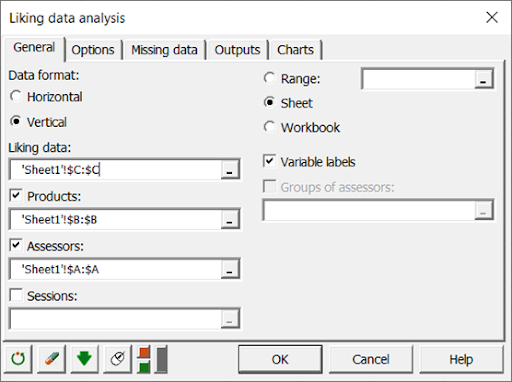
The Liking data analysis dialog box appears.
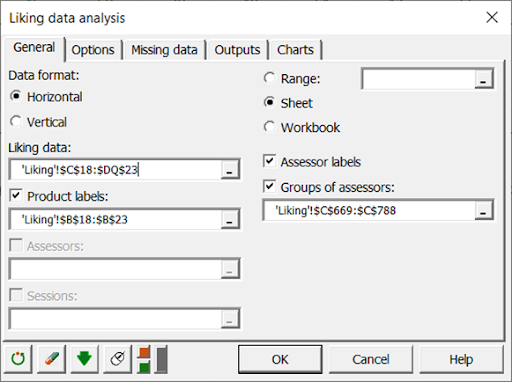
In the General tab, you can then select the liking data. The labels of the products (apples) and the assessors should also be filled in this format.
 In the Options tab, we have decided to center the assessors to avoid the effect of assessors tending to put better ratings than others. Moreover, we have chosen to cluster them.
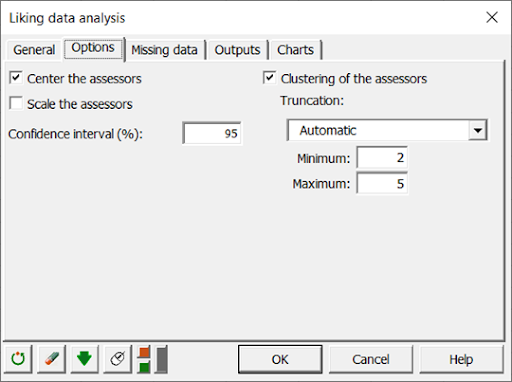 The computations start when you click the OK button.
Interpreting the results of a liking data analysis in XLSTAT
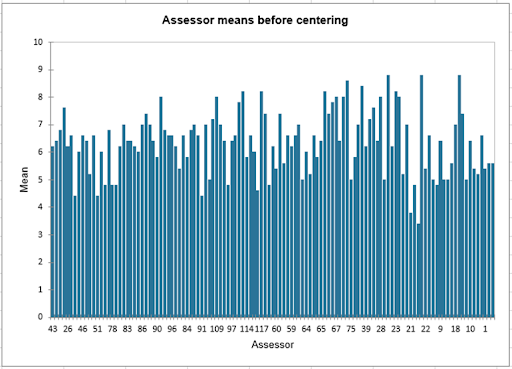
The first step consists in the visualization and analysis before centering the assessors. One of the results we can see is the mean of the assessors before centering (this result is not displayed after centering since by definition the mean of each assessor will be put to 0). We can see that some subjects clearly tend to give better scores than others, and that centering is therefore necessary.
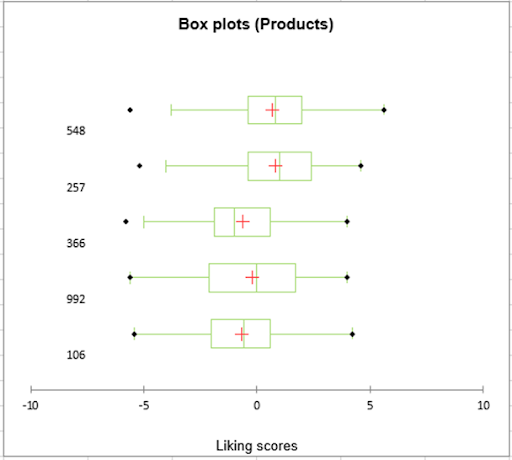
Following the centering of assessors, we can look at the product box plots. These allow us to evaluate the dispersion of the liking data for each of the apple varieties. Here we can see that apple 992 was subject to more differences in ratings than the others, since its interquartile range is larger.
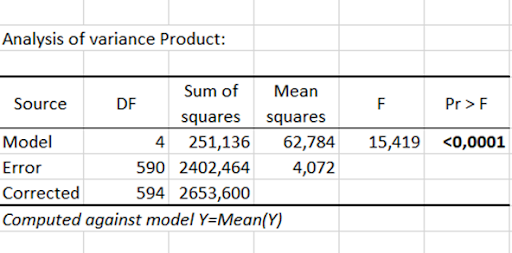
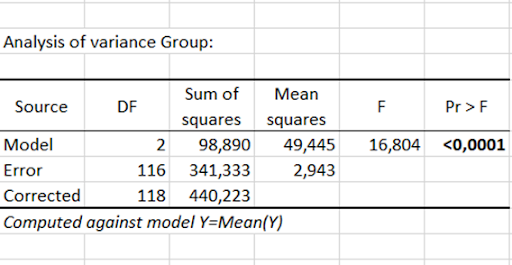
The following table is the result of the analysis of variance (ANOVA) with the liking data as the dependent variable and the products as the factor. The latter allows us to determine that there is at least one product that has a different liking mean than the others.
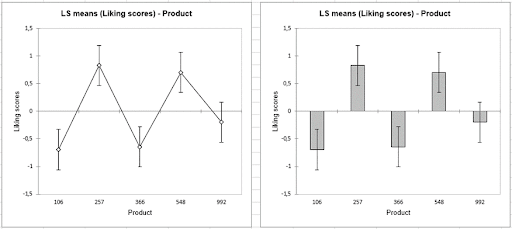
In order to determine the differences between these products, we can look at the following means charts. It is clear that we have two groups of products, with apples 257 and 548 being more popular than apples 106, 366 and 992.
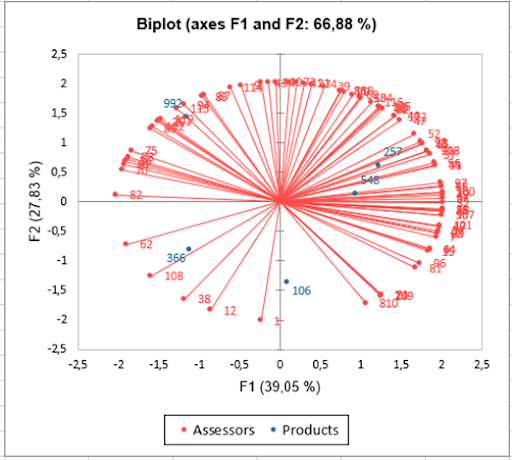
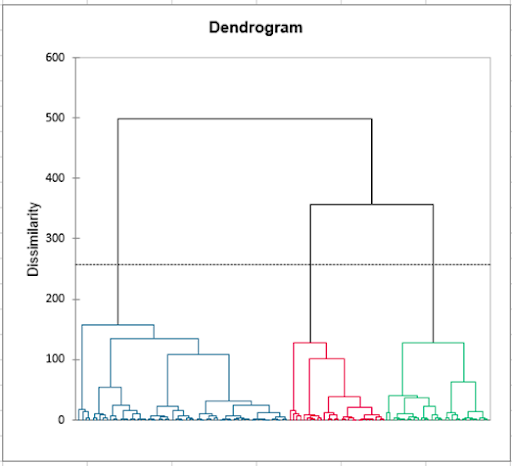
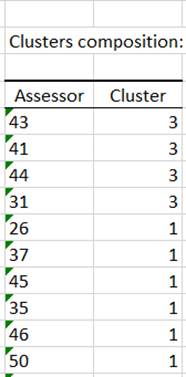
The internal preference mapping allows us to determine assessor by assessor which products are the most liked. And if, as the previous results indicate, the products 257 and 548 are the most liked, we see that we are far from being in the case of a consensus (the subjects are very dispersed). Therefore, a clustering of the assessors is a good idea to study possible groups of assessors. The latter suggests us to consider 3 clusters of assessors.
Analyse the differences between the groups of assessors
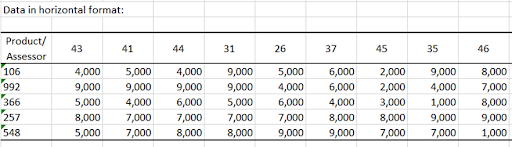
The comparison of groups of assessors is common in sensory analysis. If we are going to apply here the results of the clustering, it is also very often realized on groups known a priori (men and women for example). To realize it, we select the data in horizontal format in the "Liking data" field and we select the clusters of the assessors in the "Groups of assessors" field.
 The analysis is first done group by group, and we can for example focus on the means of the products in each group. We can see that the last group does not appreciate the apple 257 contrary to the two others but appreciates more the apple 366. The second group distinguishes itself by not appreciating the apple 992.
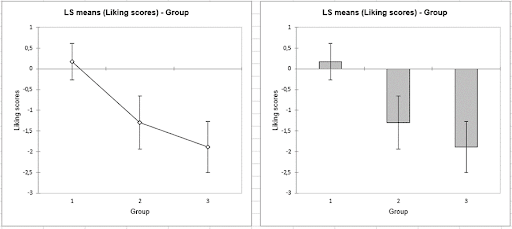
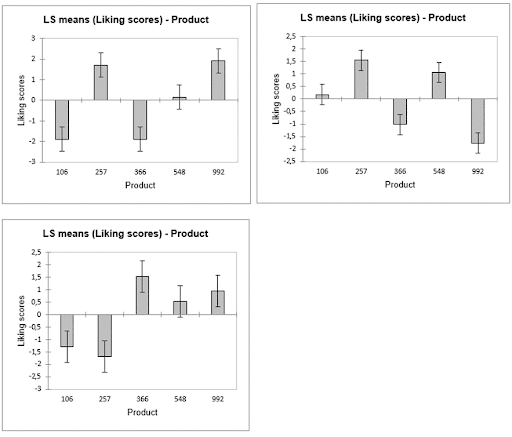 Moreover, a product-by-product comparison is made at the end of the analysis. For example, for apple 106, the ANOVA indicates that there is a significant difference in appreciation between the groups, and the graph of the means indicates that group 1 is different from the other two.
To conclude, we have started by analysing our preference data in a global way. Then, after noticing that the assessors opinions differed, we used the results of the clustering of the assessors to make comparisons between groups of assessors.
War dieser Artikel nützlich?
- Ja
- Nein