Sensory discrimination triangle test in Excel
This tutorial shows how to design and analyze a sensory discrimination triangle test in Excel using the XLSTAT software.
Dataset for perform a triangle test
A brewer wishes to commercialize a new beer and would like to know if consumers will be able to differentiate the new product from a beer of its own line of products. To test the hypothesis that both beers are similar, he wishes to use a triangle test.
Goal of this tutorial
The goal of this analysis is to first generate a design of experiments for the beer tasting, then to analyze the results in order to know if the two products are well discriminated.
In the triangle test, three samples are presented to each assessor in different orders. Within these samples, the two are similar. Assessors must identify the sample that is different from the others.
Setting up a design for a triangle test
Select the XLSTAT / Sensory data analysis / Design for Sensory discrimination test Command (see below).

Once you have clicked on the button, the Design for Sensory discrimination test dialog box appears.
Select the triangle test, and enter the number of assessors, which is equal to 20 in this test. In this tutorial we decided to use the names of products that we have defined. To do this, select the User defined option in Product codes. Then select the table with the product names. Two names per beer are necessary so that the assessor does not know in advance the different product. The samples of beer 1 are called A and C, those of beer 2 are called B and D.
Since both beer names are present, make sure the Labels included box is checked.

The calculations start when you click OK. The results are then displayed.
Interpret the results of the experimental design for the triangle test
The first table shows the names of the products used. In this tutorial, you will find the table you selected in the Product Codes option.

The following table allows you to prepare your triangle test for your 20 assessors. Each assessor tastes 3 samples of beer in the designated order, in the columns Sample 1, Sample 2 and Sample 3. He will have to recognize the beer present only once. The fourth column allows you to enter the assessors’ answer. In the next column, you find the correct answer, i.e., the sample is different from the other two. The last column allows you to indicate the result of the test. Just enter one code for a correct answer (by default +) and another code for an incorrect answer (by default -). Note: If you enter the results in the fourth column, the last column will be filled automatically.
The generated design is as following:
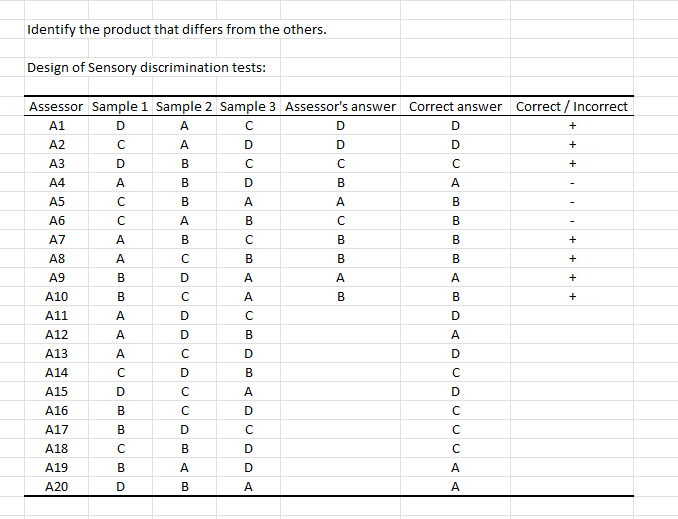
Once the design table is filled, you can analyze the obtained tasting results.
Setting up to perform a triangle test
Select the XLSTAT / Sensory data analysis / Sensory discrimination test Command (see below).

Once you have clicked on the button, the Sensory discrimination test dialog box appears.
Select the triangle test in the Test type option and the Thurstone model in the Method option. The Thurstone model assumes that the sensory profile of each beer follows a normal distribution, we will test the hypothesis that these distributions are similar by using an index called d-prime (or Thurstone delta).
We will now be able to use the results of the test on the subjects present in the last column of the experimental design. To do this, select the Data option in Data format and then select the Correct/Incorrect column of the table provided by the experimental design. Check that the code for a correct answer is the same as the one present in the data selection, here the + sign.
So, we want to check if the products can be differentiated by comparing the d-prime to 0. To do this, select the d-prime option by giving the value 0, in the Null hypothesis option. Then select the Clopper-Pearson statistic for the method of calculating confidence intervals and the power will be calculated by the Binomial distribution.

The calculations start when you click OK. The results are then displayed.
Interpretation of the results of a triangle test
The first table summarizes the selected options and indicates the proportion of correct answers.

Then the test results and interpretation are given. Here, the p-value is lower than 0.05, so we can reject the null hypothesis that d-prime is equal to 0. Therefore, we suggest that each beer does not follow the same normal distribution. We can thus reject the hypothesis that beers are similar. Furthermore, the power of our test being very high we can conclude that our test is robust enough.

The next table gives the parameter estimates including the d-prime. All parameters are significantly greater than 0. The d-prime is almost equal to 3 which is very high indicating a large difference between the two beers.

To sum up, the consumers managed to discriminate the new beer from the older one. The brewer can assume that this new product will be well identified by consumers.
War dieser Artikel nützlich?
- Ja
- Nein