Wilcoxon signed rank test on two paired samples in Excel tutorial
This tutorial will help you run and interpret a Wilcoxon test on two this guide.
What is a Wilcoxon signed test
The Wilcoxon test is a non parametric test that allows to compare two paired samples.
Two tests have been proposed for the cases where samples are paired: the sign test and the Wilcoxon signed rank test.
The sign test is based on a simple principle: we compare the number of cases where the first sample is greater than the second sample to the number of cases where the second sample is greater that the first sample. The disadvantage of the sign test is that it does not take into account the size of the difference between each pair, data which is often available.
Wilcoxon proposed a test which takes into account the size of the difference within pairs. This test is called the Wilcoxon signed rank test, as the sign of the differences is also involved.
Dataset for a sign test and a Wilcoxon signed rank test
The data correspond to an experiment in which depression is studied. Patients have been followed at two different times (0: pre-test and 6: 6 months follow-up). The variable to be compared is a depression score.
The goal of this tutorial is to compare the two periods with respect to the depression score.
Setting up a sign test and a Wilcoxon signed rank test on two paired samples
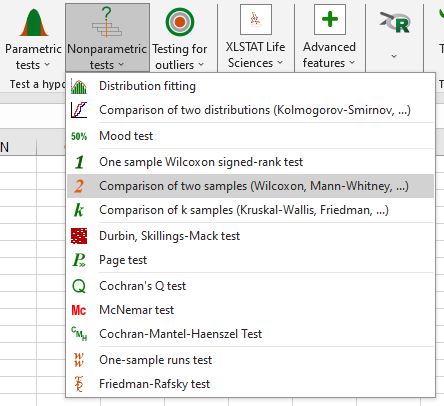
Once XLSTAT is activated, select the XLSTAT / Nonparametric tests / Comparison of two samples (Wilcoxon, Mann-Whitney, ...) command, or click on the corresponding button of the Nonparametric test menu (see below).
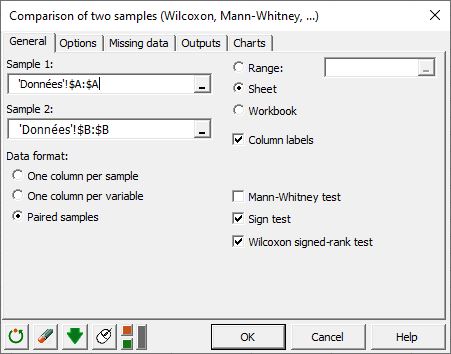
Once you've clicked the button, the dialog box appears. You can then select the data on the Excel sheet. Select the paired samples option.
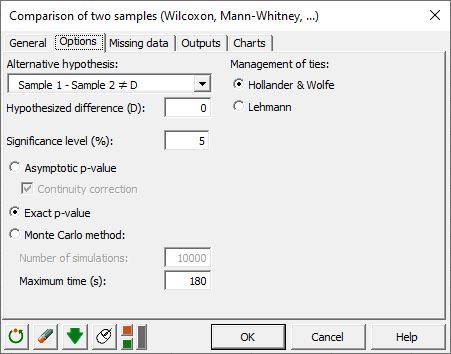
In the options tab, we suppose that the difference between samples is equal to 0. XLSTAT allows to compute the exact p-value for this test, we will not use it in this tutorial and will use the classical approximation of the p-value.
After you have clicked on the OK button, the results are displayed on a new Excel sheet (because the Sheet option has been selected for outputs).
Interpreting the results of a sign test and a Wilcoxon signed rank test on two paired samples
The first results displayed are the statistics for the samples.
For the sign test, we can see that the null hypothesis of equality is rejected. We can consider that patient state of depression has evolved.

Regarding the Wilcoxon signed rank test, the hypothesis is also rejected, which confirm the results of the sign test.
Not sure you chose the right test? This will let you know.
Was this article useful?
- Yes
- No