Friedman-Rafsky test in Excel
This tutorial will show you how to compare two distribution functions in Excel using XLSTAT.
Data to compare two distributions using the Friedman-Rafsky test
This tutorial is based on a simple dataset that contains two samples. The first sample gives the height and weight of basketball players and the second sample gives the height and weight of football players.
Setting up the Friedman-Rafsky test in XLSTAT
-
Open XLSTAT.
-
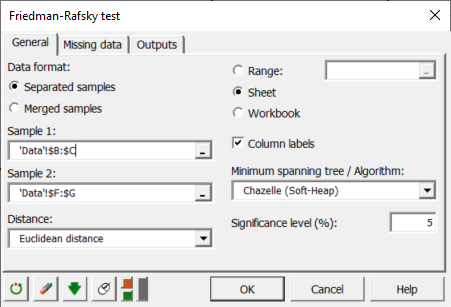
Select the XLSTAT/ Nonparametric tests / Friedman-Rafsky test. The dialog box pops up.
-
In the XLSTAT interface, select the sample related to basketball players in Sample 1, and in Sample 2, select the sample about football players.
-
Select the Euclidean distance and Chazelle algorithm to compute the minimum spanning tree in a shorter time.
-
Click on OK.
Interpret the results of a Friedman-Rafsky test
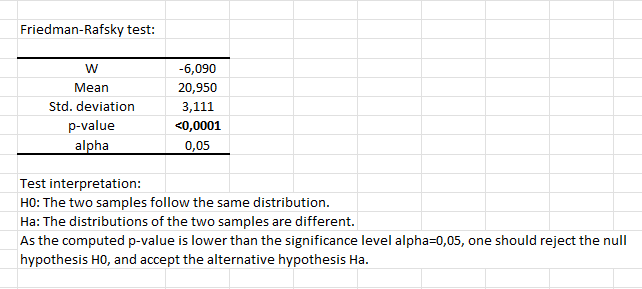
The p-value is lower than 0.05, so we reject the null hypothesis, which means that the two samples do not follow the same distribution. The result makes sense, as we know that the heights and weights of football players and basketball players are on average different.
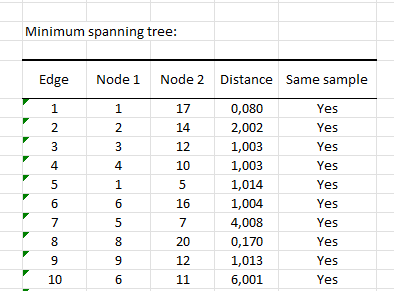
The following table gives a view of the minimum spanning tree computed using the Chazelle algorithm. In the first line, we can see that the first edge connects nodes 1 and 17. The Euclidean distance between these nodes is 0.08. The last column indicates that both nodes come from the same sample.
Was this article useful?
- Yes
- No