Kruskal-Wallis test in Excel tutorial
This tutorial will help you set up and interpret a Kruskal-Wallis test.
Dataset for running a Kruskal-Wallis test in Excel using XLSTAT
The data correspond to a sensory analysis where 10 experts have been asked to rate during two separate blind sessions the hardness of four different cheeses, on a [0->5] scale. In the tutorial on the Friedman's test, we considered that the same 10 experts rated the four cheeses (the data were paired because of that). Here, we consider that different experts rated the cheeses. Our goal is to determine if the difference in hardness between the cheeses is significant or not.
Setting up a Kruskal-Wallis test in XLSTAT
Once XLSTAT-Pro is activated, select the XLSTAT / Nonparametric tests / Comparison of k samples command.
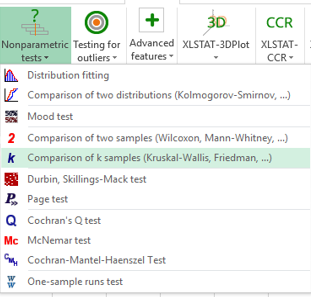
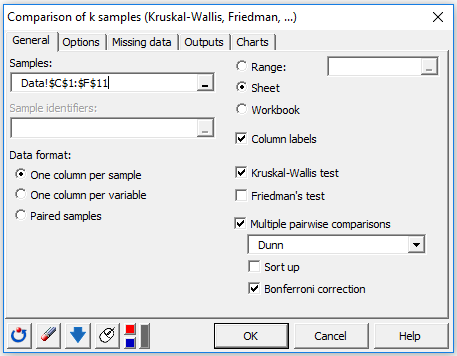
Once you have clicked on the button, the dialog box appears. Activate the One column per sample option first, then click in the Samples field, and select the data on the Excel sheet: select with the mouse the 4 columns of data corresponding to the 4 cheeses (or samples, or treatments).
As the cheeses names are included in the first row of the selection, leave the Column labels option checked.
Then select the Dunn test in the Multiple comparisons and activate the Bonferroni option, so that if the hypothesis that the cheeses are the same is rejected, we may identify which cheeses are different.
After you have clicked on the OK button, the results are displayed on a new Excel sheet (because the Sheet option has been selected for outputs).
Interpreting the results of a Kruskal-Wallis test
The first table displays the Kruskal-Waliis K statistic and the corresponding p-value. The p-value tells us that the probability of rejecting the null hypothesis although it is correct is about 0.0005. We conclude that we can securely reject the null hypothesis that there is no difference between the cheeses.

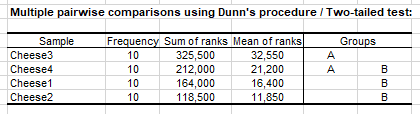
The next results allow to identify which cheeses are different from the others, as one would do with multiple comparisons tests in ANOVA. To take into account the fact that there are multiple comparisons on k groups, the Bonferroni correction is used. From the summary table below we see that the cheeses 2 and 3, and 1 and 3 are identified as different. Looking back at the data, the 3rd cheese is clearly the hardest cheese.
Was this article useful?
- Yes
- No