Fisher's F-test to compare two variances in Excel
This tutorial will help you test the difference between two observed variances, using Fisher’s F test, in Excel using the XLSTAT software.
Dataset for running a Fisher's F-test in XLSTAT to assess the equality of variance of 2 samples
The data are from [Fisher M. (1936). The Use of Multiple Measurements in Taxonomic Problems. Annals of Eugenics, 7, 179 -188] and correspond to the sepal characteristics of 100 Iris flowers described by two variables (sepal length, sepal width). There are two different species included in this example: setosa and versicolor.
Goal of tis tutorial
Our goal is to assess if there is a difference between the species for the sepal length and sepal width. We will then compare the distribution of these variables for the 2 samples.
The first thing to do is to assess if the samples follow a Normal distribution as the Fisher F-test is sensitive to data that do not follow a normal distribution. You will find those statistics computed in the Excel sheet. All 4 samples (Versicolor-Sepal length, Versicolor-Sepal width, Setosa-Sepal length, Setosa-Sepal width) follow a normal distribution.
We can now launch a Fisher's test in order to test the equality of variance of the 2 samples. If they are equals, we will be able to compare the averages.
Setting up a Fisher's F-test in XLSTAT to assess the equality of variance of 2 samples
To realize a two-sample comparison of variances test :
-
Go to the menu bar Parametric Tests / Two-sample comparison of variances.
-
The two-sample comparison of variances dialog box appears
-
In the tab General select the data for the sample 1 and 2
For Sample 1 select the column B containing the sepal length for the variety Versicolor and for the Sample 2 the column E corresponding to the sepal length for the Setosa samples.
-
The Data format is One column per sample as each column corresponds to one of the samples.
-
We select the option Sheet to get the results in a new sheet of the workbook.
-
As the columns have a label the option Column labels should be enabled.
-
The test we decide to run is the Fisher’s F-test.

-
Once all these options are set we can move on to the tab Options.
-
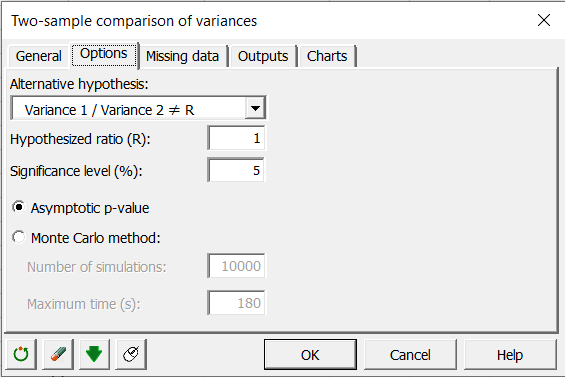
We want to test the equality of variance which means that the alternative hypothesis is : Variance 1 / Variance 2 ≠ R where R is 1.
-
The default significance level of 5% is to be kept.
We don’t have missing data so we can go directly to the tab Outputs and enable the option Descriptive statistics. The other outputs can also be selected if wanted.
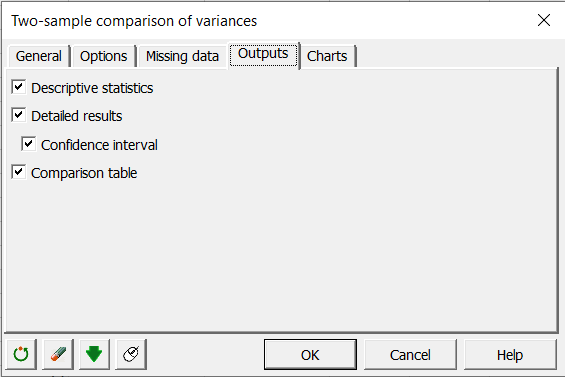
Press OK, when everything is set.
Results of a Fisher's F-test in XLSTAT to assess the equality of variance of 2 samples
The results that appear in a new sheet show that the H0 hypothesis should be rejected as the p-value 0.009 is inferior to our limit of 5%. Hence the variances cannot be considered as equal. The two populations -Versicolor and Setosa - sepal length do not follow the same distribution.
We are now going to do the same thing but for the sepal width.
The only change in the procedure described above is the data selection. For Sample 1 enlighten the column C and for Sample 2 choose the column F.

This time the variances can be considered as equal as the p-value of the test (0.189) is superior to 0.05.

As the equality of variance (also called homoscedasticity) is assumed we can run a test of comparison of means.
You can notice in the Descriptive statistic table that the mean of the sepal width for Versicolor is inferior to the mean of Setosa for the same characteristic. Therefore we can run a one-tailed test for the test on the average. One-tailed tests are generally more precise.
-
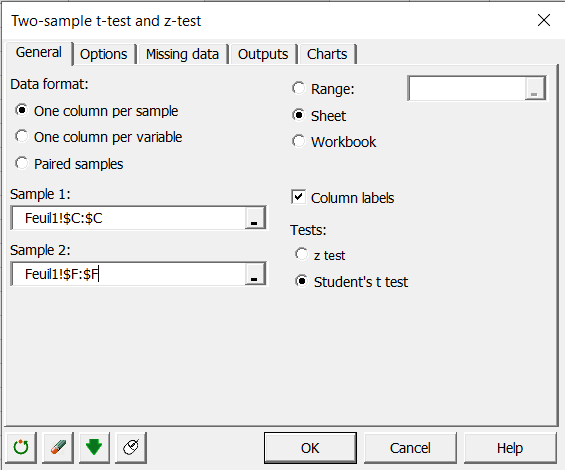
Go to the menu Parametric tests / Two-sample t-test and z-test
-
In the general tab do the same sample selection as previously for the sepal width.
-
Select the option Student’s test as we do not know the true variances of the populations.
-
In the Options tab elect the alternative Mean 1 – Mean 2 < D where D is 0.
-
We can Assume equality for the variances as we just computed the test before.

-
Click on OK.
As can be seen in the results of this test, we conclude that there is significant difference between the two means, the sepal width of Versicolor iris being smaller than the sepal width of the Setosa iris. The two populations -Versicolor and Setosa - sepal width do not follow the same distribution.

Was this article useful?
- Yes
- No