What is statistical modeling?
This article explains the purpose of statistical modeling and provides some basic theory along with concrete examples.
What is meant by statistical modeling?
Simply put, statistical modeling is a simplified, mathematically formalized method for approximating reality (i.e., what generates your data) and optionally making predictions based on that approximation. The statistical model is the mathematical equation that is used.
What is the purpose of statistical modeling?
We can use statistical modeling to explain one or more random variables by other variables or to make predictions. It is a popular data science procedure for applying statistical analysis to data sets.
Here is a basic example. Suppose you want to report the weight of a variety of potatoes. We will consider a hard way and an easy way to do this. The hard way is to spend years measuring the weight of every potato of that variety in the world and reporting your data in an endless Excel spreadsheet. The easy way is to select a sample of that variety representative of 30 potatoes, calculate its average and standard deviation, and report only those two measurements as an approximate description of that weight. Representing a quantity by an average and a standard deviation is a very simple form of statistical modeling.
Another example is attempting to represent the height of plants according to soil water content by a straight line, characterized by a slope and an intercept, drawn after an experiment with a sample of plants exposed to increasing soil moisture. This particular model is called simple linear regression.

What are dependent and explanatory variables?
In almost all cases, statistical models imply explanatory and dependent variables.
The dependent variable is the one we want to describe, explain, or predict. As a rule of thumb, the dependent variable is often the one we represent on the Y axis in modeling charts. In the plant height example, the dependent variable is plant height.
Explanatory variables, also called independent variables, are those we use to explain, describe, or predict the dependent variable(s). Explanatory variables are often represented on the X-axis. In the example of plant height, there is only one explanatory variable that is quantitative: soil water content.
Both the dependent and explanatory variables can be single or multiple, quantitative or qualitative. There are models adapted to different situations.
What if I have more explanatory variables than observations?
The presence of a large number of explanatory variables can pose a problem for classical statistical analyzes such as linear regression. To address this problem, there are methods that assume that only some of the available explanatory variables are actually relevant for modeling the dependent variable: these are the LASSO regression, RIDGE regression, and Elastic net.
What is a model parameter?
In classic, parametric models, the dependent variable(s) is linked to the explanatory ones through a mathematical equation (the model) that involves quantities called model parameters. In the plant height simple linear regression example, the parameters are the intercept and the slope.
The equation may be written like this: Height = intercept + slope*soil water content
Computations behind statistical modeling allow the estimation of model parameters and further predictions of the dependent variable.
Simple linear regression also involves a third parameter, the variance of residuals (see paragraph below).
What is a model residual?
Technically, model residuals (or errors) are the distances between data points and the model (which is represented by the straight line in the plant height linear regression example).

Model residuals represent the part of the variability in the data the model was unable to capture. The R² statistic is the part of variability that is explained by the model. So the lower the residuals, the higher the R² statistic.

What statistical model should you choose?
Choosing a statistical model is not easy. It is wrong to believe that there is an appropriate model for each data set. The pattern of associations between the dependent and explanatory variables can guide the selection of a statistical model. A graphical analysis of these relationships can be very helpful. Polynomial or nonlinear models may be more appropriate than linear models in some cases if these shapes are curved. The exact problem you are investigating may also have a direct influence on the model you choose.
This grid will guide you through the selection of the most commonly used models, depending on the type and number of dependent and independent variables, but also on the context. Solutions other than parametric models are also suggested.
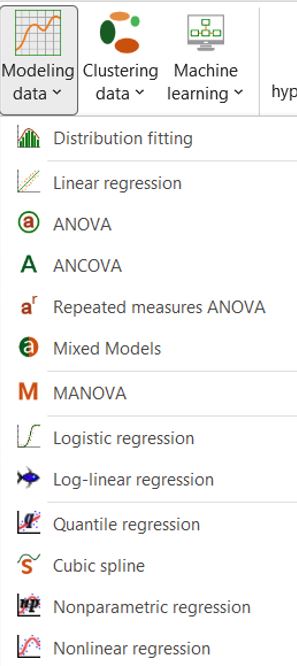
How to create a statistical model in XLSTAT?
You do not need to learn formulas by heart! XLSTAT provides easy-to-use dialog boxes that allow you to create robust models by simply selecting your data in Excel. You have access to different statistical models such as One-way ANOVA & multiple comparisons in Excel tutorial, Simple linear regression but also Random components mixed model, or Nonlinear regression.
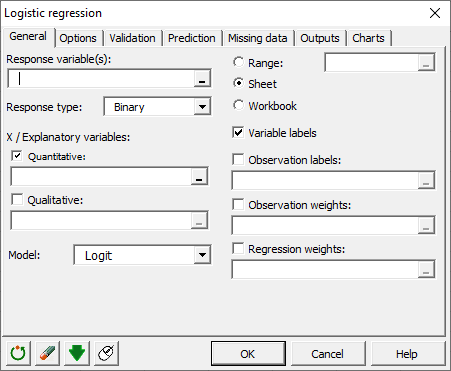
When launching a regression model, you simply have to select your variables from the datasheet. In XLSTAT, your response variables can be quantitative but also binary, ordinal, or multinomial while your explanatory variables can be quantitative or qualitative depending on the model.
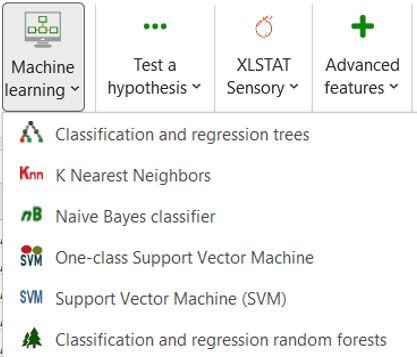
In addition to the standard linear regression models, XLSTAT also offers a wide range of supervised machine learning algorithms for classification and regression problems such as Random Forests, Support Vector Machine, k-nearest neighbors, and more.
These are available under the Machine Learning menu:
Applications of statistical modeling with XLSTAT
More than 30 tutorials are available in the XLSTAT Help Center, with real-world examples.
Was this article useful?
- Yes
- No