Deploying a simple R function in Excel using XLSTAT-R
This tutorial shows the steps for deploying a simple R function in Excel using the XLSTAT-R engine.
To make XLSTAT-R work in your XLSTAT environment, please refer to this tutorial.
Making the Rank-Based regression available in Excel - XLSTAT
For this tutorial, we choose to work on the rfit function from the {Rfit} package. It allows estimating rank-based coefficients for linear models. Those estimations are considered to be more robust with regard to outliers compared to more classical estimation approaches.
As data input, rfit thus seeks:
-
A quantitative dependent variable
-
Qualitative or quantitative independent (explanatory) variables
We will also add the possibility to display a barchart representing the regression coefficients. We will use either the XLSTAT chart engine.
Step 1: Open an XML template and fill out the Method Structure
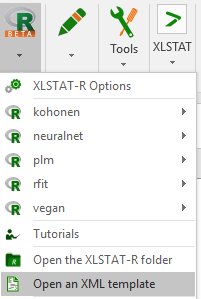
XLSTAT-R features are written in XML code. A detailed documentation on the XLSTAT-R XML syntax is available here. The complete XML code linked to this tutorial can be found on the top-right of this page. To start developing our feature, we need to open an XLSTAT-R XML template. Click on R / Open an XML template.
The template opens in your default XML editor with the path specified under the XLSTAT options, XLSTAT-R tab. However, we strongly recommend editing your XML files, using Sublime (Windows and Mac) or Notepad++ (Windows only).
Note that it is also possible to start your feature project from an existing feature. This can be useful when the feature you are willing to develop has an input or an output structure similar to one that has already been developed in XLSTAT-R. Just browse the existing features usually stored at this address: %AppData%\ADDINSOFT\XLSTAT\XLSTAT-R\groups
Now it is time to fill out the attributes linked to the Method structure. The Method structure is the root of your XLSTAT-R feature project. Here, you should define important attributes such as your feature’s name, input data structure, the R libraries it will use and so on. To fill in the Method attributes and sub-nodes, replace the template texts between the quotations.

Fill out the attributes as follows:
-
text="Rank-Based Regression". This is the name of your feature.
-
datastructure="model". This structure involves data that will be merged into an R formula. This is typical of R functions involving dependent variables and independent variables or predictors. This is the case of the rfit function. For regular data structures, simply enter "data".
-
function="rfit". This is the name of the core R function you are deploying or of your own procedure.
-
group="Rfit". This will be the sub-menu under which your function will be stored in the XLSTAT-R menu. It will also be the folder name in which you will save your XML project.
-
packages="Rfit". Include here the list of packages that should be loaded for your feature to work. If you need to include several packages, separate them with commas. For example, if you wish to include the plotrix package in order to be able to generate R charts with error bars, write packages="Rfit,plotrix".
-
family="Robust Linear Modeling". Optional attribute.
-
question="How can I obtain robust linear model estimates?". Optional attribute.
-
synonyms="Robust regression". Optional attribute.
Fill out the method subnodes as follows: - <AuthorXML>John Smith</AuthorXML>
-
<AuthorRFunction>John Kloke</AuthorRFunction>. Enter ?rfit in R to find out the name of the author.
-
<CompatibilityXLSTAT>19.5</CompatibilityXLSTAT>. The XLSTAT version under which you are developing the feature. Can be found by clicking on XLSTAT / About XLSTAT at the right of the ribbon.
-
<CompatibilityR>3.4.2</CompatibilityR>. The R version you are using. Can be found when you open the R console.
-
<DateCreated>2017.09.29</DateCreated>
-
<DateModified>2017.09.29</DateModified>. Make sure you update this date whenever you post any new modification to your feature.
-
<PackageVersion>rfit 0.23.0</PackageVersion>. Can be found by loading the packages in your R console and running the sessionInfo() command. If you have several packages, separate them with semicolons (e.g. rfit 0.23.0; plotrix 3.6-6).
-
<RDescription>Minimizes Jaeckel's dispersion function to obtain a rank-based solution for linear models.</RDescription>. Include descriptions you see in the Description section of the R functions help pages.
Step 2: Save your XML template
Locate your XLSTAT-R\groups working directory. It is usually located in %AppData%\ADDINSOFT\XLSTAT\XLSTAT-R\groups
Create an Rfit folder and save your XML template as rfit.xlm. The folder should match the method group attribute and the XML file name should match the method function attribute.
During the whole development process, we strongly advise you to check how your project is evolving within the XLSTAT-R interface. To do this: 1. Save your template
2. Open XLSTAT, go to the R menu and click on Refresh.
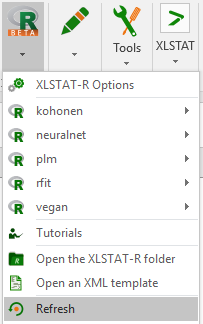
3. Open your feature within the R menu.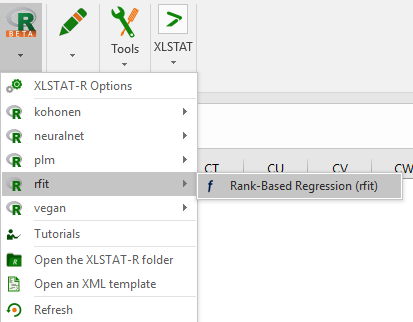
Step 3: Figuring out what to include in the user interface
Figuring out the inputs
The first questions one may ask here is what inputs to include in the XLSTAT-R user interface (i.e. the dialog box)? For a project as simple as this one, we decide to use R function’s arguments as inputs. Let’s have a look at these arguments. Open the R console, load the Rfit library and the rfit function help by typing the following command lines:
> library(Rfit)
> ?rfit
In the help documentation, under the Usage section, you will find the function with major associated arguments, and an explanation of the meaning of each argument:
rfit(formula, data, subset, yhat0 = NULL, scores = Rfit::wscores, symmetric = FALSE, TAU = "F0", ...)
In this tutorial, we will input data which will be automatically merged by XLSTAT into an R formula thanks to the model data structure within the XLSTAT-R engine. We will also let the user manipulate the symmetric Boolean argument as well as the TAU argument.
Deciding what tabs to include
The user interface (i.e. the dialog box) is configured under the <!-- START USER INTERFACE --> section. The user interface is organized in tabs. Here we decide to include the classic XLSTAT dialog box tab structure: General, Options, Missing, Outputs and Charts.
Step 4: Configuring the General tab
We start by configuring the General tab. In this tab, we mainly want to include: - A quantitative dependent variable input;
-
Quantitative explanatory variables inputs;
-
Qualitative explanatory variables inputs;
-
Optionally, observation labels.
To configure a data input field, the general DataField node can be used. However, XLSTAT-R has special nodes for dealing with data that should be merged into an R formula. These nodes have the advantage of letting the user configure the terms and interactions to include in the formula using a point-and-click dialog box. We will use these special nodes.
The tab is initiated using the following code:
<Tab text="#General" >
Here we use the # sign as the General string is translated into several languages in XLSTAT. The XML code will look up the string within the XLSTAT dictionary and display it in the dialog box with the XLSTAT configured language.
Type in the following code:
<YQuantiField text="Dependent variable" controltip="Select your dependent variable" rname="data" />
<Spacer height="2" />
<XQuantiField rname="data" optional="true" optiondefault="true" />
<XQualiField rname="data" optional="true" optiondefault="false" />- YQuantiField is the XLSTAT-R special node that configures a field for quantitative dependent variable selections. The text attribute sets the caption that will appear in the dialog box. The controltip attribute sets the tip that appears when the user hovers the mouse over the field. The rname attribute set the R data frame in which the captured data will be stored.
-
Spacer is a node used to separate dialog box elements from each other. The height attribute is set in pixels.
-
XQuantiField and XQualifield are the XLSTAT-R special nodes that configure fields for quantitative and qualitative explanatory variables to include in the R formula. They include default text attribute values. The optional attribute adds a checkbox to the field to make it optional. The optiondefault attribute sets the default value for the checkbox.
Here’s how the user interface looks like at this point:

It is now time to configure the second part of the General tab. Type in the following code:
<NextColumn />
<VarHeaders text="Variable labels" />
<Spacer height="10" />
<ObsLabelsField rname="data" />
<Spacer height="6" />
</Tab>- NextColumn allows switching to the right side of the dialog box within the current tab.
-
VarHeaders is a typical XLSTAT checkbox that states whether variable names are captured or not during data selection.
-
ObsLabelsField is also a typical XLSTAT data field in which the user can select row or observation names. Here, the captured labels will be introduced as such within the R data object.
-
</Tab> closes the General tab configuration.
Here is the completed General tab:

Time to configure the Options tab now.
Step 5: Configuring the Options tab
Here we decide to include a control on the Interactions the user wishes to include in the rfit model, as well as the symmetric and TAU arguments. - Symmetric is a Boolean argument (TRUE or FALSE). The best way to input this form of data is to draw a checkbox.
-
TAU can take one value out of a limited list of values. A Combo box would be appropriate here.
<Tab text="#Options" >
<Interactions reportgroup="1" />
<CheckBox text="Symmetric" name="SymmetricAnalysis" rname="symmetric" default="false" reportgroup="2" />
<Spacer height="6" />
<ComboBox text="Routine" name="Routine" rname="TAU" default="0" left="55" width="100" reportgroup="3" >
<Item text="Fortran" rname="F0" />
<Item text="R" rname="R" />
<Item text="None" rname="N" />
</ComboBox>
<Spacer height="6" />
</Tab>- Interactions is a special pre-configured XLSTAT node that allows the user to select the level of interactions in the model within the main dialog box. After clicking on OK, another dialog box lets the user select the specific interactions to include. The reportgroup optional attribute simply includes this input in the configuration summary within the results report. The level of interactions will be the first element "1" to include in the configuration summary list.
-
The symmetric argument CheckBox node includes several attributes. name is the XLSTAT-R internal name. rname is the R object in which the input will be stored. default is the default value of the checkbox. By default, this checkbox will produce an R object named symmetric and containing the FALSE value.
-
The Combobox node that sets the value of the TAU R argument includes item members. Each item contains an element of the argument’s list of possible elements. Within each item, the text attribute sets the text that will be displayed in the combobox. The rname attribute contains the value that will be stored within the TAU object if the item is selected. The default attribute within the ComboBox node contains the index of the item to use by default. This index starts at 0. This in this case, the default value will be "F0". left sets the number of pixels by which the control should be moved on the left. width defines the width of the control in pixels.

Step 6: Configuring the Missing Data tab
We keep the default missing tab configuration within the XML template. Those are special XLSTAT options for handling missing data. For more information, please refer to the
Step 7: Setting up the Outputs and Charts tabs
In this tutorial, we propose to keep the outputs and charts tabs XML code as they are in the original template. This will automatically generate checkbox options within the tabs depending on what is specified in the SPECIFICATION OF RESULTS TO DISPLAY IN EXCEL section (step 9).
Below is the code:
<!-- OUTPUTS TAB OF THE DIALOG BOX -->
<Tab text="#Outputs" >
<AutoOutputs stats="true" />
</Tab>
<!-- CHARTS TAB OF THE DIALOG BOX -->
<Tab text="#Charts" >
<AutoCharts />
</Tab>
In the AutoOutputs node, the stats attribute defines whether or not the XLSTAT engine should compute and display descriptive statistics on the captured data.
Before switching to the result report configuration section (i.e. specification of results to display in Excel), we propose to jump to the R code section at the bottom of the XML template. Once the code is configured, we will switch back to result configuration.
Step 8: Writing the R Code
Choosing the analysis results to display in the outputs
The easiest R object format XLSTAT-R can display as a result is data frames. Let’s have a look at a basic rfit result to check how we could extract a data frame out of it.
Open an R console, and go back to the rfit help section. Copy and paste the code in the Examples section at the bottom.
> library(Rfit)
> ?rfit
> data(baseball)
> data(wscores)
> fit<-rfit(weight~height,data=baseball)
> summary(fit)
Call:
rfit.default(formula = weight ~ height, data = baseball)
Coefficients:Estimate Std. Error t.value p.value(Intercept) -228.57144 56.14659 -4.0710 0.000146 ***height 5.71429 0.76018 7.5171 4.373e-10 ***
Signif. codes: 0 ‘***’ 0.001 ‘**’ 0.01 ‘*’ 0.05 ‘.’ 0.1 ‘ ’ 1
Overall Wald Test: 56.50621 p-value: 0
It looks like the Coefficients table is worth to display, as it includes both estimates (first column) and associated p-values (last column).
Let’s see how we could extract this specific table. Hint: the names() function often helps to check elements you can extract from R complex objects.
> names(summary(fit))
[1] "coefficients" "waldstat" "waldpval" "overall.test" "call"
Maybe the coefficients element contains what we’re looking for.
> summary(fit)$coefficients
Estimate Std. Error t.value p.value
(Intercept) -228.571442 56.1465857 -4.070977 1.459710e-04
height 5.714286 0.7601755 7.517061 4.373127e-10
Success!
Let’s check if this corresponds to a data frame:
> is.data.frame(summary(fit)$coefficients)
[1] FALSE This is not the case.
Consequently, the below transformation will be necessary at some point in the code:
> as.data.frame(summary(fit)$coefficients)
Writing up the code: a few preliminary notes
Writing up R code is usually done in the last section of the XML template (R CODE), under the RScript node. The RScript node includes ScriptLine subnodes in which you are able to insert R command lines.
There are two ways of writing R code in XLSTAT-R. You can switch from one to another using the replacebyvalue Boolean attribute in the RScript node. - replacebyvalue="true": XLSTAT-R automatically replaces rnames found in the XML code by their values whenever they are called in the ScriptLines, and if the replace attribute in the ScriptLines is set to true. This method is appropriate whenever you want to quickly program XLSTAT-R features mimicking R functions. It presents limitations if you want to manipulate R objects within a more complex R code aiming at producing further results.
-
replacebyvalue="false": XLSTAT-R automatically stores dialog box inputs into R objects, allowing a more flexible manipulation in the R code.
In this tutorial, we will use the first method for writing R code in XLSTAT-R templates.
Writing the code using replacebyvalue="true"
Type in the following code:
<RScript replacebyvalue="true" >
<ScriptLine replace="true" code="results=rfit(formula,data,symmetric,TAU)" />
<ScriptLine replace="true" code="results$CoefficientsDataFrame=as.data.frame(summary(results)$coefficients)" />
</RScript>
There are two scriptlines. The first one calls the rfit R function. The formula object is automatically generated by XLSTAT thanks to the model data structure. With the replacebyvalue="true" method, all the elements included after are replaced by their values entered in the dialog box every time the dialog box will be executed.
In the XML file, R results to show must be stored within a results object. This is why we created the results object in the first line and the CoefficientsDataFrame sub-object within the results object.
Below is a typical R script generated with this code. This script is automatically generated in the XLSTAT-R working directory every time you execute the feature in XLSTAT. The script file is likely to be found here: %AppData%\ADDINSOFT\XLSTAT\XLSTAT-R\datastore\Rfitresults\rfit.script.R > list.of.packages <- c('Rfit')
> new.packages<-list.of.packages[!(list.of.packages %in% installed.packages()[,'Package'])]
> if(length(new.packages)) install.packages(new.packages, repos='http://cran.us.r-project.org')
> library('Rfit');
> data<-read.csv(file='%AppData%/ADDINSOFT/XLSTAT/XLSTAT-R/datastore/data.csv', header=TRUE, sep=';', dec='.')
> results<-rfit(weight ~ +height,data,symmetric=FALSE,TAU='F0')
> results$CoefficientsDataFrame<-as.data.frame(summary(results)$coefficients)
> write.table(results$CoefficientsDataFrame, file = %AppData%/ADDINSOFT/XLSTAT/XLSTAT-R/datastore/Rfitresults/CoefficientsDataFrame.csv', na='', row.names =TRUE, quote=FALSE, sep=';', dec=',')
Take a look at the rfit() command line and see how the elements have automatically been replaced.
Step 9: Setting up the Outputs display in Excel
Now it is time to move back to the result report configuration section (i.e. specification of results to display in Excel). This section includes the RResults node. It includes as many Result subnodes as there are results to display in the outputs.
Insert the following code:
<RResults>
</RResults>- text: sets the result title in the outputs;
-
rname: the element from the results object to display, typically a data frame;
-
type: type of data stored in the rname elements;
-
rowlabels: the result row labels to display. If set at rdesc, the R object row labels are used;
-
collabels: the result column labels to display. If set at rdesc, the R object column labels are used;
-
chartname (optional): the name of the chart to display, based on this result;
-
charttype: the type of chart to display (see documentation for possibilities and details). barchart(0/1) will display a bar chart. The zero (0) means the table’s row labels will be used as bar labels, and the one (1) means the first column will be used as data to display (coefficient estimates).
This code will display the coefficients table as well as a basic XLSTAT bar chart of the coefficients.
It is definitely possible to produce an equivalent chart in R, using the following code instead:
<RResults>
<Result text="Coefficients" rname="CoefficientsDataFrame" type="double" rowlabels="rdesc" collabels="rdesc" chartname="Coefficients chart, R style" charttype="r" rplotformat="emf" rplotcode="barplot(results$CoefficientsDataFrame[,1], names.arg=row.names(results$CoefficientsDataFrame), ylab='Estimates', xlab='Coefficients',main='Coefficients Bar Chart')" />
</RResults>
Check the Outputs and Charts tab now. Result checkboxes have automatically appeared:


At the bottom of the XML file, do not forget to close the method structure using the code below:
</Method>
Step 10 Enjoy using your new feature in XLSTAT!
Here are some screenshots of the feature executed on the XLSTAT. Download the dataset on the top right of the page. Open R / Rfit / Rank-Based Regression
Fill in the general tab as follows:

Activate the Interactions option in the Options tab.

Click OK.
In the dialog box that appears, select the terms you want to include in the model:

Select the terms you want to keep and click OK.
Interpret the results.


Was this article useful?
- Yes
- No