Student's t-test on two paired samples tutorial
This tutorial will help you compare two observed means (this guide).
Student's paired t-test: when to use it
Student's paired t-test allows to compare the means of two series of measurements performed on the same statistical units. For example: the photosynthetic rate of 30 plants is followed at two moments during the day: morning and afternoon. Student's paired t-test can be used to detect a change in photosynthesis between the two dates. We say paired because every plant is measured twice, so data is organized by pairs. If we had 30 plants for the morning measurements and 30 different plants for the afternoon measurements, the t-test for independent samples would be more appropriate.
Dataset for a Student's paired t-test
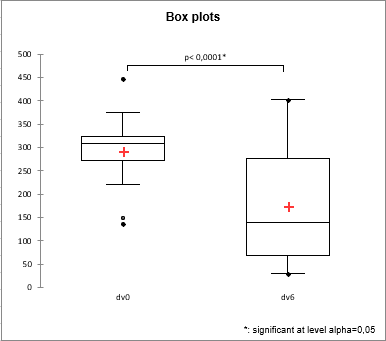
The data correspond to an experiment in which depression is studied. Patients have been followed at two different times (0: pre-test and 6: 6 months follow-up). The variable to be compared is a depression score.
The goal of this tutorial is to compare the two periods with respect to the depression score.
Setting up a Student's paired t-test on two paired samples
Once XLSTAT-Pro is activated, select the XLSTAT / Parametric tests / Two-sample t-test and z-test command, or click on the corresponding button of the Parametric tests menu (see below).

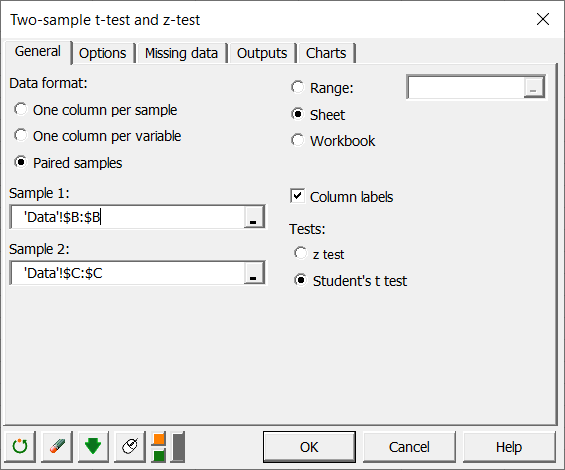
Once you've clicked the button, the dialog box appears. You can then select the data on the Excel sheet. Select the Paired samples option.
Select one sample per sample field.
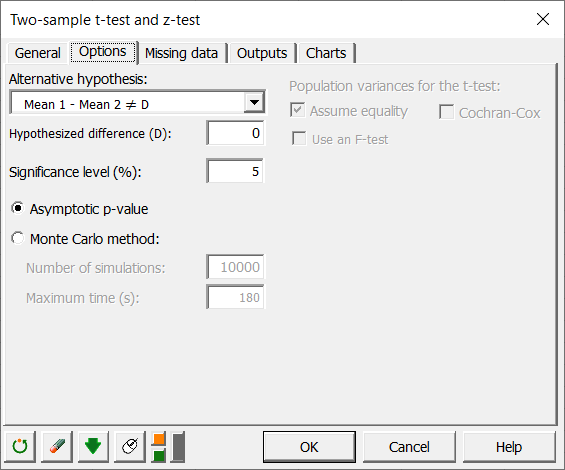
In the Options tab, we enter 0 in the hypothesized difference field. This reflects the null hypothesis we are willing to test: mean(sample 1) minus mean(sample 2) equal 0.
After you have clicked on the OK button, the results are displayed on a new Excel sheet.
Interpreting the results of a Student's paired t-test
The first results displayed are the statistics for the samples.
They are followed by the results of the paired t-test:
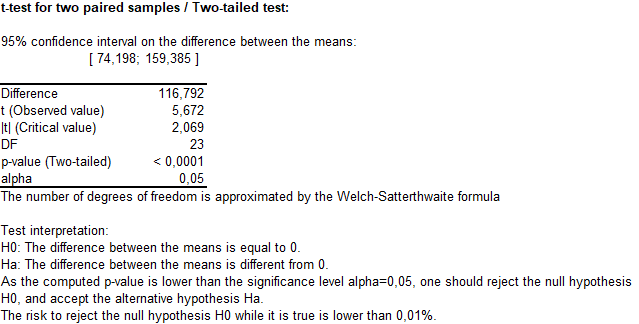
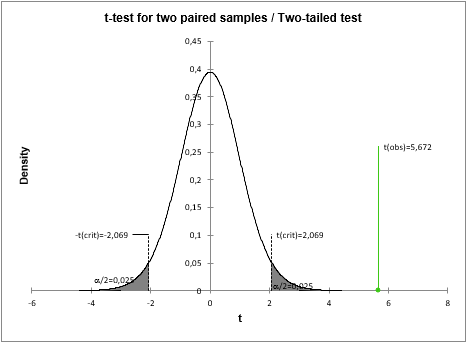
The 95% confidence interval on the difference between the two means (116.792) does not include the null hypothesized difference we chose (zero), which indicates that the mean difference between the two means is unlikely to be zero. The p-value carries a similar information: p < 0.0001, which is lower than the significance level alpha (0.05). This means that we can reject the null hypothesis with a very low risk of being wrong. In other words, the difference between the two means is statistically significant.
Did you know?
Just like all parametric tests, the Student's paired t-test is reliable only if the paired differences follow a normal distribution. You may compute those differences and then follow the XLSTAT Wilcoxon non-parametric test instead.
Was this article useful?
- Yes
- No