Cox proportional hazards model in Excel tutorial
This tutorial will show you how to set up and interpret a Cox proportional hazards model in Excel using the XLSTAT software.
Cox proportional hazards model
The proportional hazards model has been introduced by Cox (1972) and it is based on a classical regression scheme. The estimation of the model is performed with a specific type of maximum likelihood estimation called partial likelihood. An estimation of the coefficients of the model is obtained supposing the proportional hazard hypothesis holds.
The Cox regression model is a useful method to determine the impact of predictor variables on a patient's survival time. It applies to survival data, that is, a time variable, a censorship variable (binary variable), and explanatory variables. This model is based on a so-called maximum likelihood estimation developed by Cox (1972).
Dataset to run a Cox proportional hazards model
The data have been obtained in Edmunson J.H., Fleming T.R., Decker D.G., Malkasian G.D., Jefferies J.A., Webb M.J., and Kvols L.K (Different Chemotherapeutic Sensitivities and Host Factors Affecting Prognosis in Advanced Ovarian Carcinoma vs. Minimal Residual Disease. Cancer Treatment Reports, 63:241-47, 1979) and represent a randomised trial comparing two treatments for ovarian cancer. Our goal is to determine which covariate influences the survival time.
The futime variable is the time data; the fustat variable is the status variable. The covariates are the age of the patient at the beginning of the study (age), the treatment group (rx), the ECOG performance status (ecog.ps), and a qualitative variable which is the residual disease present (resid.ds: 1 = no, 2 = yes).
Setting up a Cox proportional hazards model in XLSTAT
-
After opening XLSTAT, select the XLSTAT / Advanced features / Survival analysis / Cox Proportional hazards model feature.
-
Once you've clicked on the button, the Cox proportional hazards model box will appear. Select the data on the Excel sheet. The Time data corresponds to the durations when the patients either died or were censored. The Status indicator describes whether a patient died (event code=1) or was censored (censored code = 0) at a given time.
-
Three covariates are quantitative and can be selected in the quantitative field, and one is qualitative and can be selected in the qualitative field.

-
Other options can be selected on the other tabs of the dialog box like stratification of the model, individual residuals computation, ties handling method selection and so on.
-
The computations begin once you have clicked on OK. The results will then be displayed on a new Excel sheet.
Interpreting the results of a Cox proportional hazards model
The first table displays a summary of the data. We can see that the number of observed times (time steps) is equal than the number of observations. The results will therefore be the same, whether one chooses the Breslow method or the Efron method.

Descriptive statistics are then displayed for each variable.

The next table gives several indicators of the quality of the model (or goodness of fit). These results are equivalent to the R2 and to the analysis of variance table in linear regression and ANOVA. The most important value to look at is the probability of Chi-square test on the log ratio. This is equivalent to the Fisher's F test: we try to evaluate if the variables bring significant information by comparing the model as it is defined with a simpler model with no impact of the covariates. In this case, as the probability is lower than 0.05, we can conclude that significant information is brought by the variables.

The following table gives details on the model. This table is helpful in understanding the effect of the various variables.

On this table, we can see from looking at the probability of the Chi-squares that the variable most influencing survival time is age. This shows that the age of the patient at beginning of the study has a significant effect on survival time. The hazard ratio is obtained as the exponential of the parameter estimate.
The following table is the result of the proportionality test. The rho column gives the correlation between the normalized Schoenfeld residuals and the time vector (in our case: 1 - Kaplan Meier). The other two columns are the test statistic and the associated p-value.

It can be noted that for all the covariates, the p-value is greater than alpha = 0.05. This indicates that there is no violation of the proportional risk assumption.
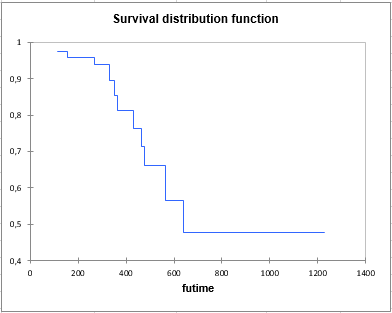
Finally, the cumulative hazard function is displayed:
This study has shown that the only covariate with a significant impact is the age. The associated coefficient being positive, we can say that the risk increases by 1.13 (Hazard ratio) each time we take a year. The other covariates do not have a significant effect on the survival time.
Was this article useful?
- Yes
- No