Proportional hazards model with interval censored in Excel
This tutorial will show you how to set up and interpret a proportional hazards model with interval censored in Excel using the XLSTAT software.
Proportional hazards model with interval censored
This proportional hazard model is a useful method for determining the impact of predictor variables on a patient's survival time. It applies to survival data, that is, censored data, whether left censored, right, interval, or uncensored, and explanatory variables. This model is based on a method developed by Lianming Wang, Christopher S. McMahan, Michael G. Hudgens and Zaina P. Qureshi (2016).
The first proportional hazard model, introduced by Cox in 1972, works only uncensored data and right censored data. An XLSTAT function is also available for this model. See here.
Dataset to run a proportional hazards model with interval censored
We illustrate the application of a proportional hazard model with data from the article by Jane C. Lindsey and Louise M. Ryan (Statistics Canada, Volume 17, No. 17). 2, 1998, 219-238) on resistance to zidovudine in patients undergoing treatment for AIDS.
These data are compiled from patients at a study site participating in four trials in the AIDS Clinical Trials Group. Since drug resistance testing is expensive, relatively little data is available. Of the 31 patients with at least one test, 13 are right censored (their last measurement showed no resistance to zidovudine), 13 are left censored (only one measure was available and resistant), and 5 are interval censored (one measurement showed sensitivity and the next showed resistance).
The information given by the covariates are: - The stage of the disease (early = 0, late = 1). - The dose of zidovudine (low = 0, high = 1). - The CD4 lymphocyte count at baseline (100-399 cells / mm3 and> 400 cells / mm3).
Our goal is to determine the impact of a number of explanatory variables on the survival time of patients.
Setting up a proportional hazards model with interval censored
After opening XLSTAT, select the XLSTAT / Advanced features / Survival analysis / Cox Proportional hazards model command.
 Select the Left endpoint (Left), Right endpoint (Right), Censored (Censored), and Quantitative (Stage and Dose) data as shown below.
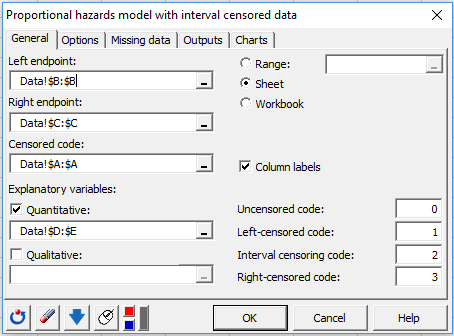 Other options can be selected on the other tabs of the dialog box:
- Optimize or not the number of spline knots,
- Add interactions in the model,
- Set the convergence criteria,
- Delete or estimate missing data (date and censorship data must be complete).
The computations begin once you have clicked on OK. The results will then be displayed on a new Excel sheet.
Interpreting the results of a proportional hazards model with interval censored
Descriptive statistics on the quantitative variables as well as the censored data are displayed in the following tables:
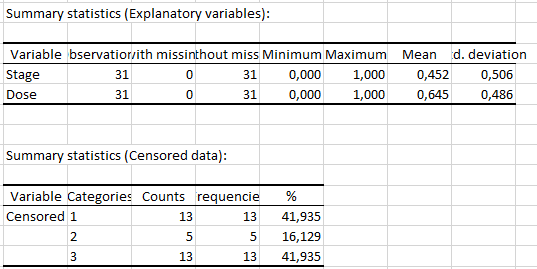 Here we find the 13 left-censored data, the 5 interval censored data and the 13 right censored data.
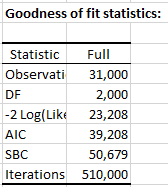
The next table summarizes the quality indices of the model. These statistics are useful for judging the suitability of a model and comparing it to other models.
Here we find the 13 left-censored data, the 5 interval censored data and the 13 right censored data.
The next table summarizes the quality indices of the model. These statistics are useful for judging the suitability of a model and comparing it to other models.
 By choosing the knots optimization option, we will try to get the model with the best AIC (i. e. the lowest AIC).
The following table provides details on the fitted model. These results are helpful in understanding the effect of the various variables.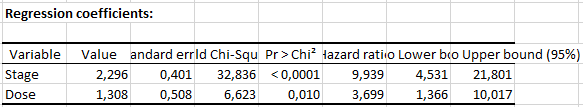 We see that both variables have a significant impact on the survival time of patients.
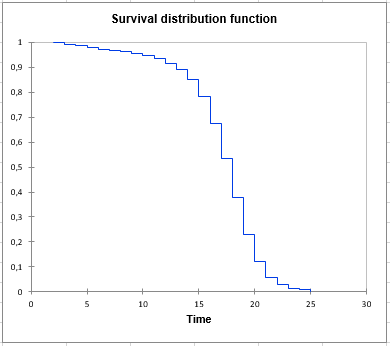
Finally, the cumulative survival function is displayed taking into account the explanatory variables.
We see that both variables have a significant impact on the survival time of patients.
Finally, the cumulative survival function is displayed taking into account the explanatory variables.
 To conclude, we may suggest that the stage variable, having a positive value, indicates that a patient being in an advanced stage of the disease, will have a higher risk of being resistant to zidovudine. Although the effect of the dose is less significant, we can also say a patient being at a higher dose group has a higher risk is of being resistant to zidovudine
Was this article useful?
- Yes
- No