Compare k proportions in Excel tutorial
This tutorial shows how to compute and interpret an k proportions test analysis in Excel using the XLSTAT software.
Not sure this is the statistical test you are looking for? Check out this guide.
Comparing k proportions
A proportion is a way to measure on a [0, 1] scale, how many observations belong to a given category, compared with the total population size. It is computed as the ratio between the number of observations that belong to the category of interest and the total population size.
To compare k proportions, the statistical methods require that you know the population sizes. So the inputs can either be the proportions and the corresponding population sizes, or the number of observations that belong to the category of interest, and the corresponding population sizes.
Dataset for comparing k proportions
The data correspond to 6 different series of screws used on rallye cars. The number of screws that pass the quality tests correspond to “Success” and the other to “Failed”.
Our goal is to determine if the quality of the 6 series can be considered as different or not, and if there is a difference, we want to determine if there is one or more series responsible for the difference, in order to make the necessary adjustments for the next productions.
Setting up a test to compare k proportions
After opening XLSTAT, select the XLSTAT / Test a hypothesis / Parametric tests / k proportions test command in the XLSTAT menu, or click on the corresponding button of the "Parametric tests" toolbar (see below).

Once you've clicked on the button, the dialog box appears. Select the data on the Excel sheet.
Select first the frequencies of Success events (column B), then the Sample sizes (column D), which are here the total number of screws produced in a given series.
The Sample labels are also selected (column A). All the tests are selected. The Column labels option is activated as the first row of the selected data contain a column header.

The computations begin once you have clicked on OK.
Interpreting the results of a test comparing k proportions
The first results that are being displayed correspond to the Chi-square test. The Chi-square test is used on contingency tables to test if columns and rows are independent. In this particular case where we are studying a binary event (success/failure), independence of rows and columns is equivalent to no difference between the proportions of successes across the series. The contingency table is automatically reconstructed by XLSTAT from the input data.
The Chi-square test concludes that there that there is at least one series that differs from the others. However, we notice that the p-value is very close to the significance level.
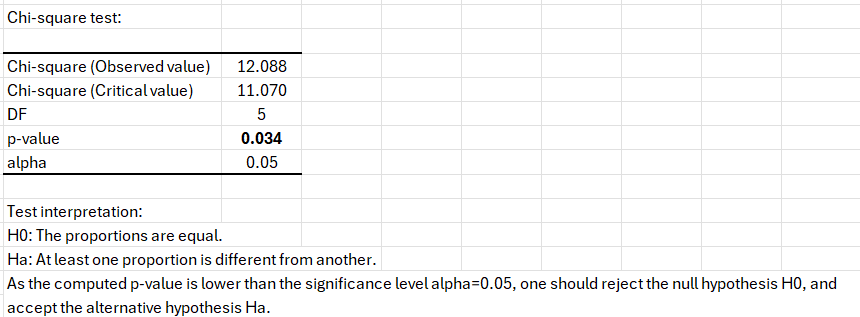
We know that the Chi-square test is an asymptotical test that should better not be used when too many cells of the contingency table have low values. As this is the case here, it is recommended to run the simulations based test (Monte Carlo test). The principle is to generate many random contingency tables that have the same marginal sums and to compute the chi-square distances on these tables. Then, we determine how many tables give lower chi-square values so that we can see how “extreme” our table is.
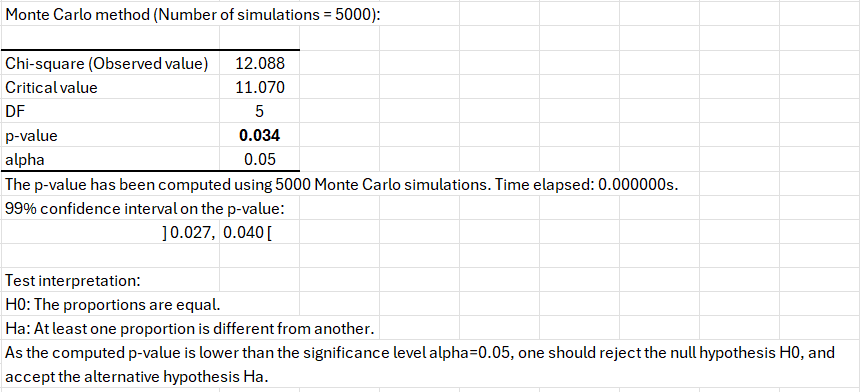
We see that the Monte Carlo test with 5000 simulations gives almost the same result as the Chi-square test, and confirms the fact that at least one series is different from the other.
In order to identify which series differ, we use the Marascuilo procedure. The results are displayed below.
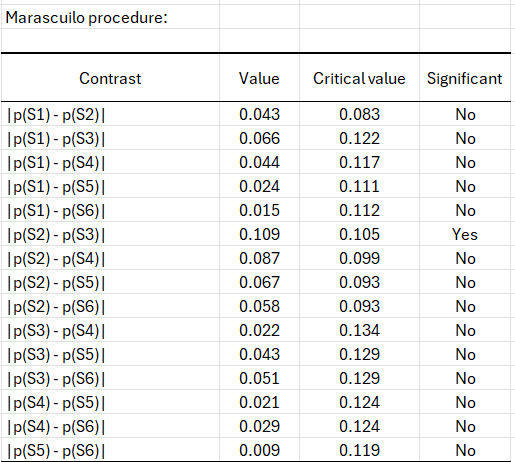
We see that the two most different series are S2 and S3. We conclude that the important distance between these two series is responsible for the rejection of the H0 hypothesis of the k proportions test. The reasons why the S3 production had a better quality should be further investigated.
Was this article useful?
- Yes
- No