Choosing an appropriate method validation tool
This guide describes method validation tools and will help you figure out which method best fits your needs.
All the methods mentioned below can be found under the Method Validation menu in XLSTAT, except for linear regression, which is found under the Modeling data menu, Correlation tests which are part of the Correlation / association tests menu, and Gage R&R features which are part of the Statistical Process Control (SPC) menu.

What is method comparison?
Method comparison tools help investigating agreement between two methods used to measure the same parameter. They are widely used in the medical field when developing measurement instruments to replace more expensive, invasive, or time-consuming instruments measuring the same parameter. Several aspects can be addressed, including Limits of Agreement as well as constant and proportional error or biases.
The methods developed below only work on quantitative variables. Other statistical methods such as Cohen’s Kappa are appropriate for studying agreement between methods measuring qualitative or categorical variables.
Bland-Altman analysis: assessing constant error and Limits of Agreement
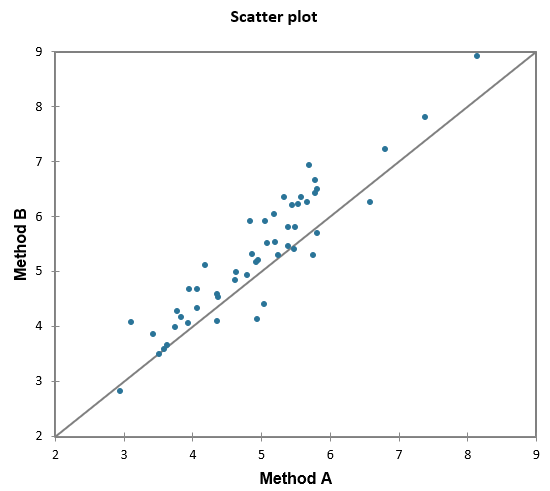
Bland-Altman analysis is a popular technique allowing to evaluate consistency between two measurement methods. Let us compare two methods (A and B) aiming at measuring a clinical outcome. The outcome is measured using method A and method B on 50 patients.
In the scatter plot below, we represent method B on the Y axis and method A on the X axis. Each point corresponds to a patient. Ideally, points should be aggregated around the 45° (Y = X) line. In the chart below, most of measurements from Method B seem to be shifted up by a certain value compared to Method A. This is a systematic constant error or bias. Further below, we will address proportional error, which is another type of bias.
 Agreement between two methods has often been evaluated through correlation analysis, with high correlation indicating good agreement, although this approach is not recommended. Correlation analysis involves pitfalls when used for this purpose. For instance, it does not account for constant or proportional errors.
The Bland and Altman analysis allows a more thorough investigation of agreement and helps measuring constant bias accurately. Among the outputs of this analysis, we may find the Bland and Altman plot, most of the time representing:
- Y axis: differences between the two methods for each statistical unit (patients in our case).
- X axis: Average between the two methods for each statistical unit.
 The Y = 0 black horizontal line is the ideal line of zero difference between the two methods. The blue lines represent the constant bias with its 95% Confidence Interval. The red lines represent the 95% Confidence Interval of differences or the 95% Limits of Agreement between the two methods. This means that differences between the two methods will fall between these two limits 95% of times. Acceptability of this range should usually be determined by users a priori according to their field of expertise.
Bland and Altman’s analysis also helps detecting the presence of a proportional error, which means the difference between the two methods depends linearly on the magnitude of the measurement. For instance, in the scatter plot below, method B yields lower measurement values compared to method A at weak magnitude (left part of the chart). On the other hand, method B overestimates measurements compared to method A at high parameter magnitude (right part of the chart). This proportional bias can clearly be seen in the form of a linear tendency in the Bland and Altman plot.

 Many more results and options are available in the XLSTAT Bland and Altman analysis feature. For instance, it is possible to work on percent change instead of raw differences on the Y axis. This is useful when the variability of differences increases according to the magnitude of the measured parameter.
Now how can we quantify constant and proportional errors when comparing two methods?
Many more results and options are available in the XLSTAT Bland and Altman analysis feature. For instance, it is possible to work on percent change instead of raw differences on the Y axis. This is useful when the variability of differences increases according to the magnitude of the measured parameter.
Now how can we quantify constant and proportional errors when comparing two methods?
Deming and Passing-Bablok regressions: quantifying constant and proportional biases
To quantify constant and proportional bias between two methods, it is possible to launch a simple linear regression with one method as the dependent variable and the other one as the independent. However, classic linear regression has a major drawback in method comparison. One of the assumptions of linear regression is that the independent variable is not subject to measurement error. Some adapted regression tools have been developed to address this issue. These methods include the Deming regression as well as the Passing and Bablok regression. Both techniques add an error term to each of the Y and the X variables.
Just like regular simple linear regression, both Deming and Passing-Bablok regressions estimate an intercept and a slope from which constant and proportional biases can be estimated:
The estimated intercept represents the constant bias, whose significance can be assessed by looking at the associated confidence interval, and whether it includes zero (not significant) or not (significant).
Proportional bias is represented by the difference between the regression slope and the Y = X line slope, which equals one. Significance of this bias can be asssessed by checking whether the confidence interval associated to the regression slope includes one (not significant) or not (significant).

Deming or Passing-Bablok?
The Deming regression is parametric and as such has more stringent assumptions to meet compared to the Passing and Bablok regression, which is nonparametric. For instance, residuals of a Deming regression must follow a normal distribution, and the Passing-Bablok regression is less sensitive to outliers.
When variability in differences changes according to the magnitude of the measurement, the Deming regression can be adapted, and becomes a weighted Deming regression (activate proportional errors in the dialog box). Also, if the variances of measurement methods are known, they can be introduced manually in the options tab.
Passing- Bablok regression can be adapted to instruments measuring the same parameter but not on the same scale, and with a possible negative correlation (activate Part III – different scales in the options tab).
Repeatability, Reproducibility and Youden plots
To assess repeatability and reproducibility using XLSTAT, we recommend using the Gage R&R for quantitative data or Gage R&R for attributes, which are part of the Statistical Process Control (SPC) menu, and dedicated to these issues.
However, Youden plots are remarkably effective to investigate visually and intuitively between-lab reproducibility and within-lab repeatability for a certain measurement. Also, Bland-Altman analysis allows for quantifying repeatability for each method, under the condition that the user provides several paired measurements per statistical unit – which can be a patient or an operator for instance (use the Groups field).
Was this article useful?
- Yes
- No