Gage R&R for Attributes in Excel tutorial
This tutorial will help you set up and interpret a Gage R&R (Reproducibility & Repeatability) analysis for attributes in Excel using the XLSTAT software.
Dataset for running a Gage R&R Attributes Analysis in Excel using XLSTAT
The data correspond to the assessment of the skin health state of 15 patients by 5 appraisers in two repetitions. Skin health state is evaluated on a 5-point ordinal scale: Excellent, Good, Medium, Bad, Very Bad. Skin conditions were also assessed biologically in order to have reference values.
Data are stored in an observations/variables table which contains the appraisers’ names, the patients’ identifications, the measurements made by the appraisers and the reference values. For information only, there is a fifth column including the repetitions id.
Goal of this tutorial
The aim of this tutorial is to conduct a Gage R&R study for Attributes to control and assess the quality of a measurement process. More precisely, we seek to judge the ability of 5 appraisers to evaluate the skin condition of 15 patients based on visual appraisal. Results are compared to reference values of skin condition obtained by biological analysis.
Setting up a Gage R&R Attribute Analysis
To conduct a Gage R&R study for attributes, select the XLSTAT / SPC / Gage R&R Attributes feature.
 The SPC Gage R&R for Attributes dialog box appears. In the General tab, select the observations/variables table format (one column for all measurements). Then, select the Estimated State column in the Measurements field and choose the Ordinal data type. Select the Appraiser column in the Operators field and the Patient column as Parts. Activate the Reference option and select the Effective State column in the Reference field.
 In the Options tab, activate all the statistics and enter 95 in the confidence interval field.
 In the Outputs tab, activate Agreement to display the assessment agreement. In the Charts tab, activate Agreement charts and the two sub-options Within operator and Operator versus reference. The computations begin once you have clicked on OK.
Interpreting the results of a Gage R&R Attribute Analysis in XLSTAT
The results are displayed in four sections: Within operator, Between operators, Operator versus reference and All versus reference. In each section, three to four tables are displayed.
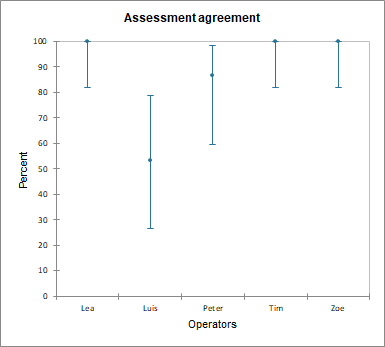
The first output is the assessment agreement table. In the Within operators’ assessment agreement table, we see that 15 patients (inspected) were evaluated, and Lea has agreed with herself over the repetitions on the rating of the 15 patients (matched), that is 100% of patients were matched with a 95% confidence interval ranging from 81.90% to 100%; while Luis has agreed with himself for only 8 patients, that is 53.33% with a 95% confidence interval ranging from 26.59% to 78.73%.
 The assessment agreement table is illustrated by the assessment agreement chart showing the percent agreement for each appraiser with their confidence interval.
 The second table contains the Fleiss’ kappa for each operator and each response in the Within operator and the Operator versus reference sections, and for each response in the Between operator and the All versus reference sections.
In the Within operators’ section, we see that Lea has a Fleiss’ kappas of 1.00. In fact, she is in total agreement with herself. Luis shows an overall Fleiss’ kappa of 0.39, significantly different from 0 (p-value < 0.05). However, such a low value demonstrates poor agreement. A general rule indicates that values of Fleiss’ kappa greater than 0.75 indicate good to excellent agreement.
 The third table provides Cohen’s kappa for each operator and each response in the Within operator and the Operator versus reference sections, and for each response in the Between operator and the All versus reference sections.
The Within Operator Cohen’s kappa can only be computed for each operator if there are exactly two repetitions on each part and the Between Operators Cohen’s kappa can only be computed for two operators with single repetition.
The Cohen’s kappa’s are in agreement with the Fleiss’ kappa’s.
 The fourth table shows the Kendall’s coefficient of concordance in the Within operator and the Between operator sections, and the Kendall’s correlation coefficients in the Operator versus reference and the All versus reference sections.
Lea, Tim and Zoe have Kendall’s coefficients of concordance of 1, indicating a strong association between the two repetitions. Peter shows a Kendall’s coefficient of concordance of 0.946, also demonstrating strong association. These 4 coefficients are associated to p-value < 0.05, the null hypothesis (coefficient is equal to 0) is rejected. Luis has a Kendall’s coefficient of concordance of 0.772 with a p-value of 0.087, the null hypothesis cannot be rejected.
 Finally, let’s have a look at the Operator versus reference Kendall’s correlation coefficient. Results imply that there is a strong association between the evaluations of Lea, Tim and Zoe and the reference (coefficient close to 1). The associations between Luis’ evaluations and the reference and between Pierre’s evaluations and the reference are lower (0.735 and 0.516 respectively) but still significantly different from zero.

Conclusion
Using the Gage R&R analysis for attributes in XLSTAT, we studied the agreement between each assessor and the reference, but also with themselves across different measurements and with the other assessors. This allows us to evaluate their repetability (agreement with themselves) and reproductibility (similarities in the measurements taken by different assessors).
Was this article useful?
- Yes
- No