Friedman non parametric test in Excel tutorial
This tutorial will help you set up and interpret a Friedman test on this guide.
Dataset for running a Friedman test
Setting up a Friedman test in Excel using XLSTAT
Select the XLSTAT / Nonparametric tests / Comparison of k samples command, or click on the corresponding button of the Nonparametric test toolbar (see below).
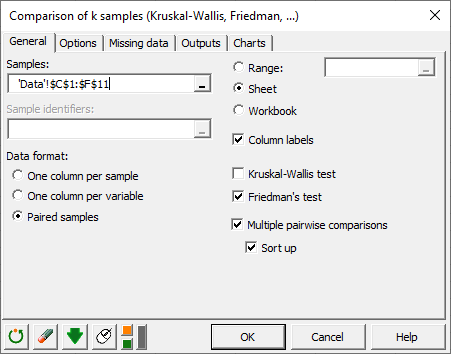
Once you have clicked on the button, the dialog box appears.
In the General tab, activate the Paired samples option first, then click in the Samples field, and select the data on the Excel sheet: select with the mouse the 4 columns of data corresponding to the 4 cheeses (or samples, or treatments).
As the cheeses names are included in the first row of the selection, leave the Column labels option checked. Then activate the Multiple comparisons option so that if the hypothesis that the cheeses are the same is rejected, we may identify which cheeses are different.
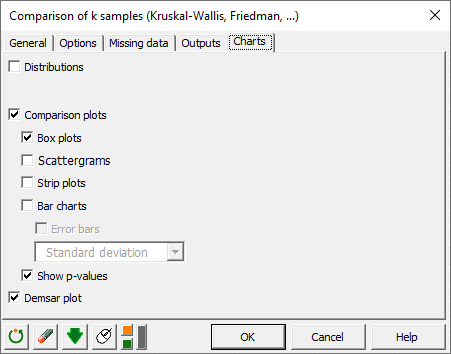
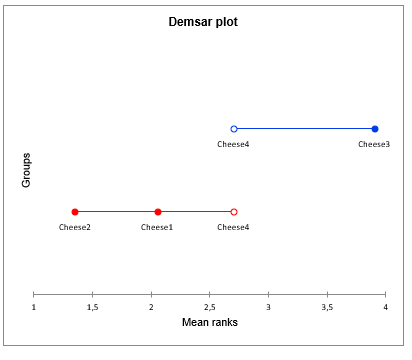
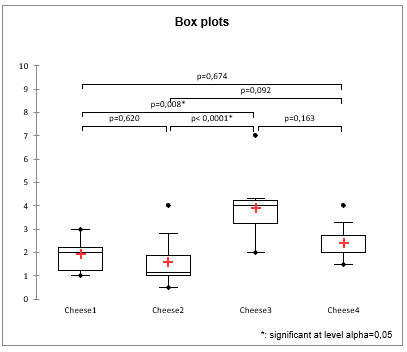
In the Charts tab, activate the Box plots and the Demšar Critical difference diagram. These charts help us to easily visualize significant differences for each pair of groups.
After you have clicked on the OK button, the results are displayed on a new Excel sheet (because the Sheet option has been selected for outputs).
Interpreting the results of a Friedman test
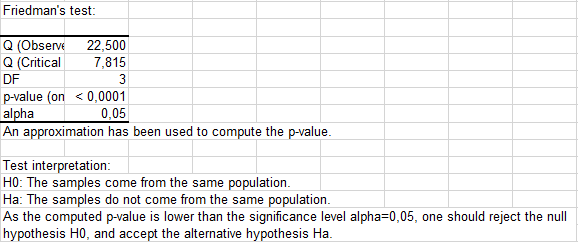
The first table displays the Friedman's Q statistic and the corresponding p-value. The p-value tells us that the probability of rejecting the null hypothesis although it is correct is lower than 0.0001. In that case we can conclude that we can securely reject the null hypothesis that there is no difference between the cheeses.
The next results allow to identify which cheeses are different from the others, as one would do with multiple comparisons tests in ANOVA. To take into account the fact that there are multiple comparisons on k groups, the Nemenyi's procedure is used. From the summary table below we see that the cheeses 2 and 3, and 1 and 3 are identified as different. Looking back at the data, the 3rd cheese is clearly the hardest cheese.
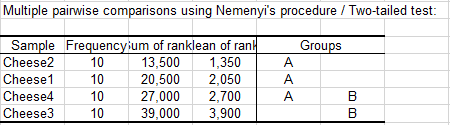
The resulted groups from the Nemeny's pairwise procedure can be visualized below:
We can also check the p-values of all pairwise comparisons in a single box plot:
Was this article useful?
- Yes
- No