How to automate an XLSTAT routine analysis
This tutorial shows how to automate a routine analysis in Excel using the XLSTAT software.
Dataset for automating a routine analysis
The data used is the process measurements of food samples.
We are going to create a Principal component analysis template on one dataset and use it on the second.
Activate the advanced options
-
Open the first file Automation_1.xlsm.
-
Open the XLSTAT's Options.
-
In the Advanced tab, check the option Show the advanced buttons in the dialog boxes.

The next step of the automation procedure is to set up your statistical analysis.
Generating the code to automate a routine analysis
-
Select the XLSTAT / Analyzing data / Principal components analysis command.
-
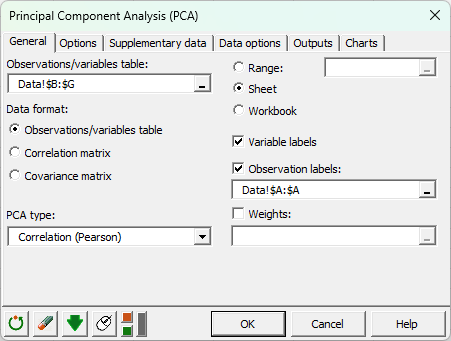
In the General tab, choose Observations/variables table.
-
Select Columns B to G.
-
Select Correlation (Pearson) as the PCA type.
-
Tick Observation labels and select column A.
-
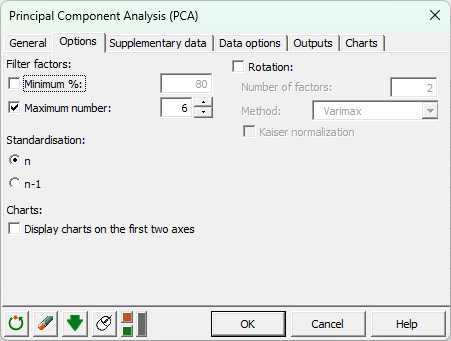
In the Options tab. Tick Maximum number and set the value to 6. This way all the components will be calculated.
-
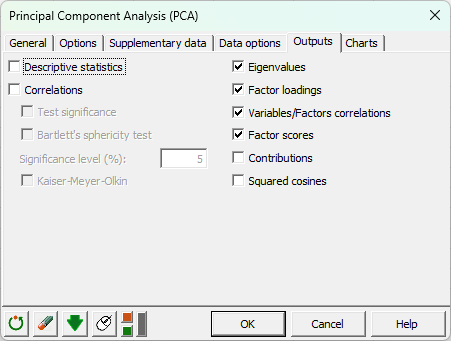
In the Outputs tab, select the following: Eigenvalues, Factor loadings, Variables/Factors correlations, and Factor scores.
-
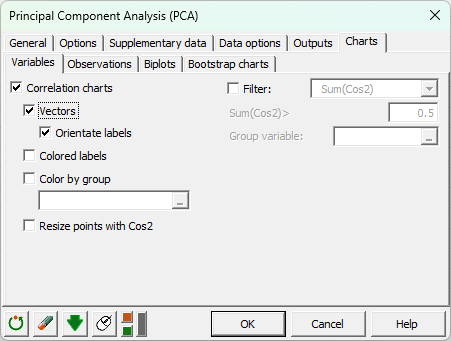
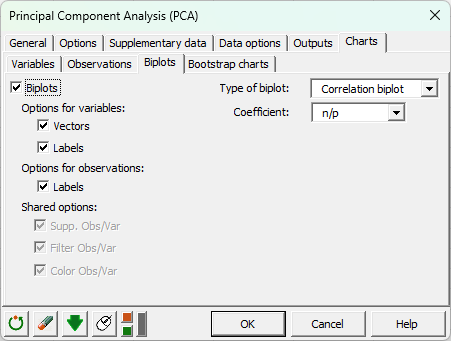
In the Charts tab, select Correlation charts, Observations charts, and Biplots.
Now we have specified all the settings, we will save the code to be reused.
-
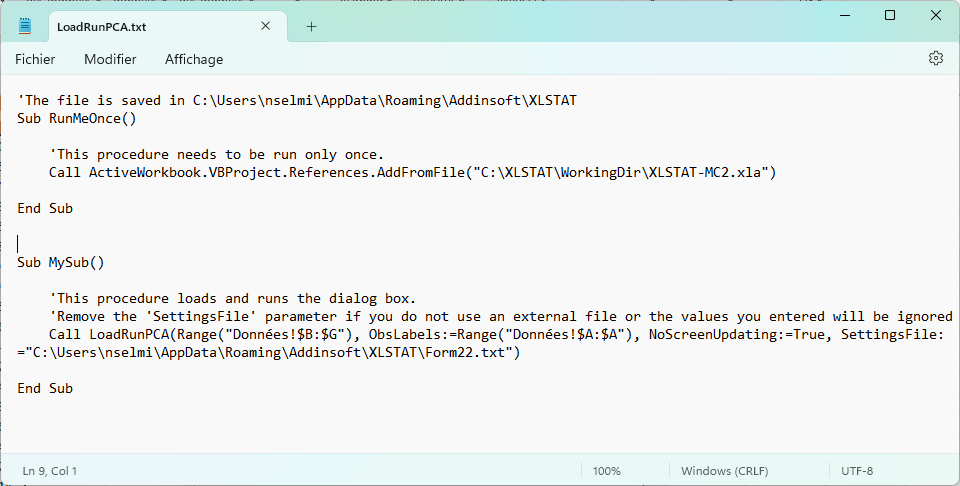
Click on the gray button at the bottom left of the dialog box to generate the VBA code that will allow you to run the dialog box from your code.
![]()
Once you have pressed the button, a Notepad document will appear containing the VBA code. Save the code under a name that is easy for you to remember, for example, "VBA-PCA-recipe1".
-
Click on OK to launch the analysis.
-
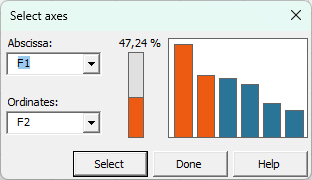
Choose the plot for the axes F1 and F2, then click on Select.
-
Change the selection to Abscissa F3 and Ordinates F4 and click again on Select.
-
Click on Done.
Take a look at the biplot.
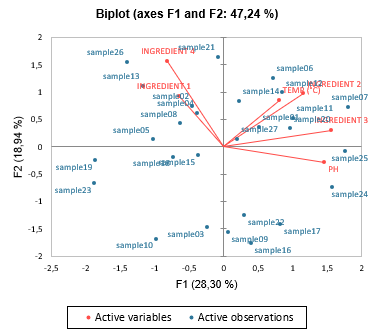
This process is usually stable, so we can expect little variation. You can see that all the samples are centered tidily around the middle of the plot.
Reusing the VBA code
-
Open the second file, Automation_2.xlsm.
-
Press Alt+F11 together in order to launch the Visual Basic Application.
-
Select Sheet1 in the folder VBAProject(Automation_2.xlsm).
-
Right-click and opt for the action Insert / Module.
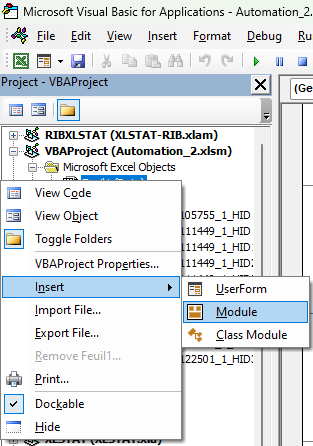
-
Copy and paste the code contained in the Notepad file into this module.
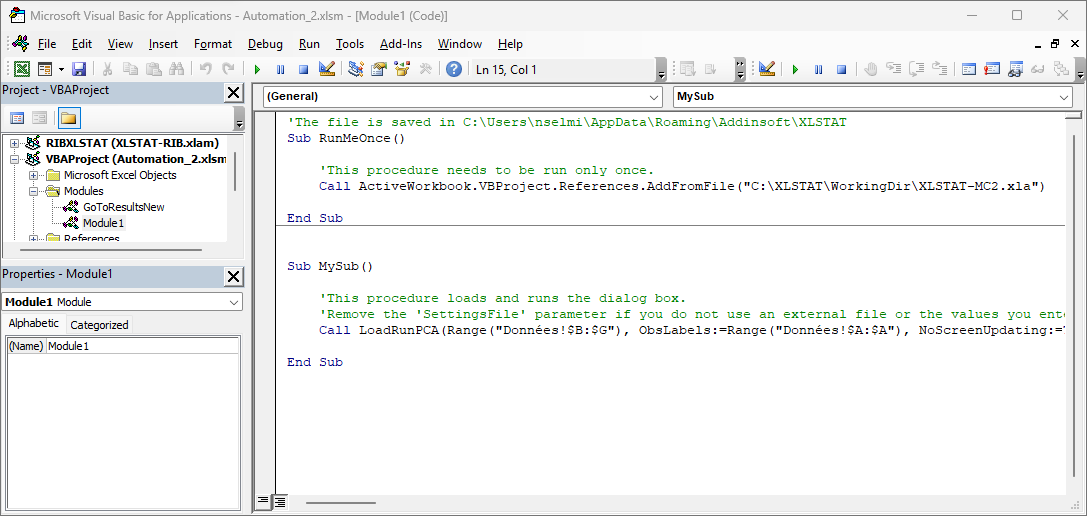
Note: At this step, you can add more codes to enable the program to perform other actions.
-
Position the cursor before the beginning of the name of the procedure, called "RunMeOnce".
-
Click on Run/ Run Sub/Userform.
-
Repeat this step for the "MySub" procedure.
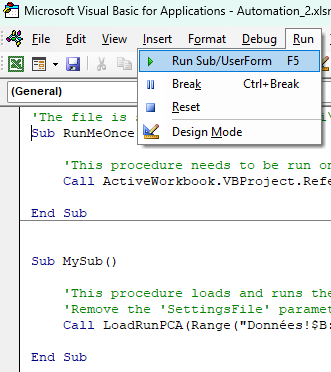
This will in turn execute the code in question, and you now have a sheet "PCA" containing the results.
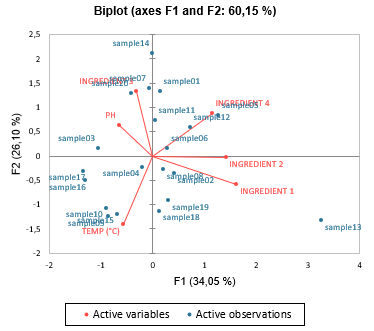
Now, if we look at the biplot of the second analysis, we notice that this time one of the samples seems to be further away than the other samples. Sample 13 may be an outlier.
Was this article useful?
- Yes
- No