How to use XLSTAT functions within an Excel sheet
On top of user-friendly dialog boxes, XLSTAT offers the possibility to instantly launch a wide range of analyses using simple functions within an Excel spreadsheet. This allows you to benefit from XLSTAT algorithms while linking Excel cells and performing simple or complex Excel operations.
Available functions in XLSTAT
Over 130 XLSTAT functions are available covering 7 main themes. An exhaustive list along with a description of each function is accessible in this PDF document.
Among the XLSTAT functions that are currently available, some of them solve numerical issues that have been found with the built-in Excel functions, or complement the set of Excel statistical functions.
To access these functions, open the Insert Function window in Excel and select the XLSTAT category:

The XLSTAT functions cover 7 main themes:
1. Statistical functions (13 functions)
These functions enable you to run 13 statistical tests on your data directly from the formula bar in Excel. Here are some examples:
XLSTAT_DataSim, XLSTAT_EmpiricalCDF, XLSTAT_GetRank, XLSTAT_Linest, XLSTAT_Logistic, XLSTAT_MannWhitneyTest, XLSTAT_Proportion_CI and more.
2. Time Series functions (7 functions)
These functions enable you to study trends and stationarity in time series:
XLSTAT_ARIMA, XLSTAT_ARIMA2, XLSTAT_ExpoSmooth, XLSTAT_ExpoSmooth2, XLSTAT_Garch, XLSTAT_HoltWinters and more.
3. Descriptive statistics (20 functions)
These functions enable you to describe your data in a univariate, bivariate or multivariate way: XLSTAT_Biserial, XLSTAT_Centile, XLSTAT_Covar, XLSTAT_Correl, XLSTAT_FisherExact and more.
4. Matrix functions (4 functions)
These functions enable you to perform matrix operations directly in XLSTAT: XLSTAT_MDeterminant, XLSTAT_MInverseX, XLSTAT_MProduct_XY, XLSTAT_MProduct_XtrX
5. Cumulative distribution functions (31 functions)
These functions enable you to estimate a cumulative distribution function directly from the formula bar: XLSTAT_CDFArcsineG, XLSTAT_CDFBernoulli, XLSTAT_CDFbeta, XLSTAT_CDFBinomial, XLSTAT_CDFExponential, XLSTAT_CDFLogistic and more.
6. Inverse distribution functions (29 functions)
These functions enable you to estimate the inverse cumulative distribution functions of the functions above: XLSTAT_InvCDFArcsineG, XLSTAT_InvCDFBernoulli, XLSTAT_InvCDFbeta, XLSTAT_InvCDFBinomial, XLSTAT_InvCDFExponential, XLSTAT_InvCDFLogistic and more.
7. Probability density functions (32 functions)
These functions enable you to estimate probability distribution functions: XLSTAT_PDFArcsineG, XLSTAT_PDFBernoulli, XLSTAT_PDFbeta, XLSTAT_PDFBinomial, XLSTAT_PDFExponential, XLSTAT_PDFLogistic and more.
How to use XLSTAT functions within Excel cells
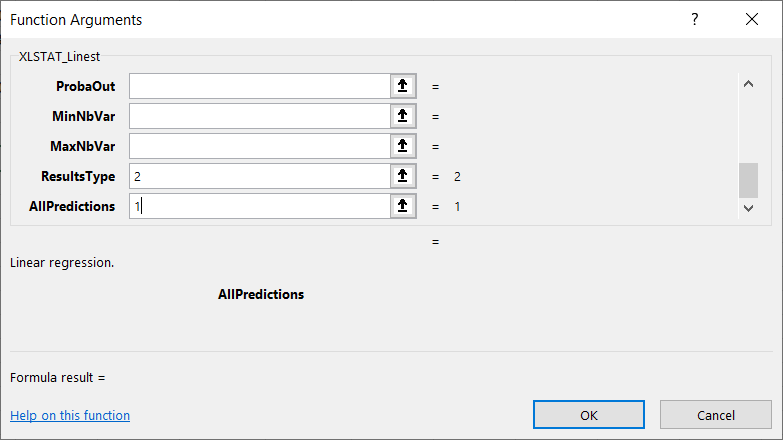
In order to illustrate the use of an XLSTAT function within an Excel sheet, we suggest an example that shows how to set up and launch a linear regression with XLSTAT_Linest. This function takes several arguments, the most important ones being:
-
The Y variable to be explained
-
The X explanatory variables
-
The type of results to display (predictions, goodness of fit statistics or regression coefficients)
Other arguments such as the presence of an intercept (true by default), the observations to predict (last one by default) and the observation weights (1 by default) can be selected.
Fitting a regression using the XLSTAT_Linest function
The following example uses a dataset coming from kaggle.com and contains socio demographic variables.

We will try to predict life expectancy based on the year, GDP and population. We’ll then compare XLSTAT’s and Excel’s LINEST functions.
To use an XLSTAT function, simply type “=” followed by the name of the function or use the Insert / Function menu of Excel, and choose XLSTAT from the drop-down menu. Finally, select the XLSTAT_Linest function.

Select Life Expectancy (column A) as the variable to explain (Y) and the Year, GDP and Population (columns B, C and D) as the explanatory variables (X), without selecting the column headers.

We wish to display the regression coefficients so we have to enter 2 in the resultType field.
Alternatively, we can enter a formula in an Excel cell as follows:
=XLSTAT_Linest(A2:A2263,B2:D2263,,,,,,,,,,,,2), all missing arguments being set to their default values.
After you click OK or Enter, the regression coefficients along with the intercept are displayed.
We can see, in order, the coefficients for the Year (0.28), the GDP (3.29*10^-4), the Population(-1.94*10^-9)and finally the intercept (-494.6).

We can also display Goodness of fit statistics (resultType=1) and predictions (resultType =0).
The Goodness of fit statistics include the number of observations, the number of observations without missing values, the degrees of freedom, the R2, the adjusted R2, the MSE, the RMSE, the MAPE, the DW, Cp, AIC, SBC and PC.

The predictions can be displayed for all observations (allPredictions=1) or only for the last one (allPredictions=0).

A comparison with Excel’s Linest function
Now, let’s try to run the same model using Excel’s Linest function.


The same coefficients are returned: first for the Population, then for the GDP, then for the Year and finally the Intercept.

However, we can see that Excel offers less arguments than the XLSTAT_Linest function such as the tolerance, selection model mode (e.g. stepwise), weights and more.
XLSTAT returns on top predictions, which you cannot directly compute using Excel’s Linest.
Conclusion
It is possible to use functions within Excel cells to run a wide range of statistical analyses based on XLSTAT algorithms. We remind you that XLSTAT uses Excel only for inputting data and displaying results. All computations are done in C++ and are based on proven algorithms. This means powerful computations, high precision and additional options compared to standard Excel’s functions.
Was this article useful?
- Yes
- No