How to set up an analysis using XLSTAT
This tutorial provides a comprehensive overview of how to set up an analysis in XLSTAT.
Goal of this tutorial
This tutorial will guide you through the process of configuring and running data analyses using XLSTAT.
Selecting your analysis
-
Once XLSTAT is opened, you will see the different groups of analyses/functions available for use.
In this example, we will set up a simple linear regression. To access this feature, please follow these steps:
-
Select the XLSTAT / Modeling data / Linear Regression command.
-
Once you have clicked on the button, the Linear Regression dialog box appears.
Setting up the analysis
-
To select the data you need, click on the range selector (you can click anywhere in the blue rectangle).
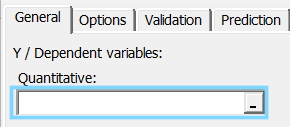
Depending on the type of analysis you may need to do one or several selections. Note that the expected type of variable is defined as either qualitative or quantitative to make it easier for your use.
In this example, the data starts from the first row, so it is quicker and easier to use column selection.
-
To quickly select a column, just click on the name of the column, as you would do with Excel.
-
Then select the next columns by leaving the mouse button pressed and dragging the mouse cursor over the columns to select.

Note: You can select either columns or ranges. It is also possible to select non-adjacent data. For more ways to select data, please visit our dedicated tutorial.
-
You may need to specify if the variable(s)/sample(s) in the selection have labels. In this case, simply tick the option Variable labels.

If you do not, you may get an error when proceeding to the calculations if the values are non-numerical.
-
You can also define the observations/units/cases labels; tick the Observation labels option and click on the range selector to select them.

The last thing to do in the General tab is to decide where the results should be displayed. You have three possibilities:
-
At a specific place in a spreadsheet, option Range. Here you have to use the range selector to specify the location,
-
In a new sheet, option Sheet,
-
In a new workbook, option Workbook.

-
Then you should go through the other tabs and select the desired options. Pay special attention to the tabs Outputs and Charts, as they are used to select which results should be displayed.
Launching the analysis
-
To proceed to the calculations click the OK button.
-
After clicking OK a summary will appear. If you realize you need to modify your settings you can go back to the dialog box by clicking on the Back button.

The following video explains how to set up an analysis in XLSTAT.
Was this article useful?
- Yes
- No