Run a linear regression on millions of data points in Excel
This tutorial explains how to set up and run a linear regression on large data files into Excel using the XLSTAT software.
Dataset
Data are fictitious and were created for this tutorial. The file contains only a very limited number of observations but you can repeat the below procedure using txt or cvs files containing millions of rows.
The goal of this tutorial is to show a) how to import a large txt file into Excel using the Import data tool of XLSTAT and b) how to run a linear regression on the imported data.
Setting up the import of a large data file with XLSTAT
XLSTAT allows loading data into the computer’s memory rather than the worksheet. Therefore, we are able to load data files which exceed the standard Excel worksheet size (1,048,576 rows by 16,384 columns in Excel 2016).
Once XLSTAT is open, select the XLSTAT / Modeling data / Regression function.
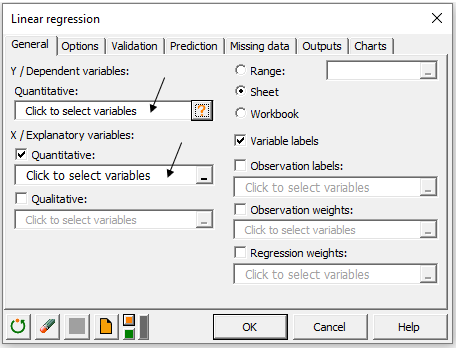
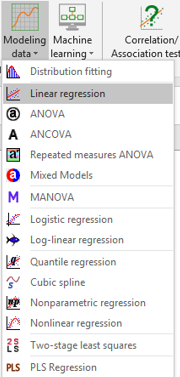 The Linear Regression dialog box then appears.
To use a text file as data source, click on the mouse icon until the orange paper sheet appears. A question mark appears then automatically next to the first data field.
 To load the data file, click on the question mark next to the Quantitative dependent field.
The Import data file dialog box then appears.
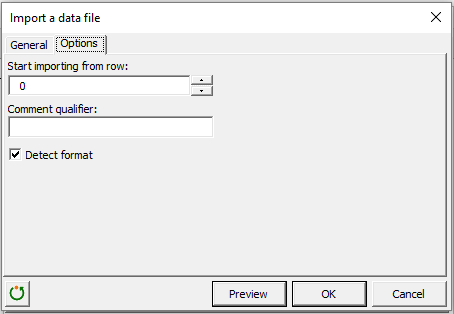
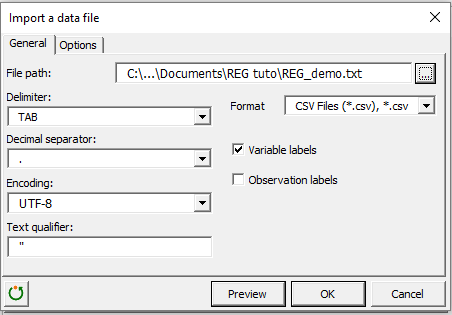 Set up the different parameters in order to read the file. These are a) the Delimiter which defines the separator of each column (in this data file, TAB is used), b) the Text qualifier which defines a complex element (i.e. an element with space, delimiter character, etc), c) the Start import at row field allowing to skip the firsts lines used as header (here, none are skipped) and d) the Comment qualifier field necessary for commented text in the file (here, for each line, all text after the character “#” isn’t loaded).
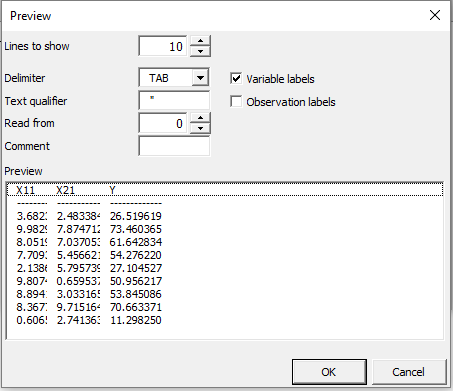
 To see a preview before loading the data file, click on the Preview button:
Running a linear regression on a large data file
Once the data file is imported, click into the first data field of the dialog box in order to select the Dependent variable:
 A new window pops up listing the imported variables.
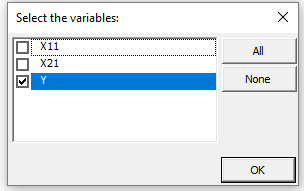 Select the variable Y and click on the OK button. In the same way, select the variables X11 and X21 in the Explanatory field.
Once the variables to be included in the mode are selected, we can choose, in the other tabs, the appropriate options and output according to the needs of our analysis. The computations begin once you have clicked on the OK button. The results will then be displayed on a new sheet.
To see how you can interpret the results of such an analysis using XLSTAT, check out our tutorials on multiple linear regression.
Was this article useful?
- Yes
- No