Partial least squares discriminant analysis PLSDA tutorial
This tutorial shows how to set up and interpret a Partial Least Squares Discriminant Analysis in Excel using the XLSTAT software.
Dataset for running a Partial Least Squares discriminant analysis
The data are from [Fisher M. (1936). The Use of Multiple Measurements in Taxonomic Problems. Annals of Eugenics, 7, 179 -188] and correspond to 150 Iris flowers, described by four variables (sepal length, sepal width, petal length, petal width) and their species. Three different species have been included in this study: setosa, versicolor and virginica..
Goal of the Partial Least Squares discriminant analysis in this example
Our goal is to test if the four variables allow to discriminate the species, and to visualize the observations on a 2-dimensional map that shows as well as possible how separated the groups are. It is based on the Partial Least Squares method and allows to treat multicollinear data, missing values and data set with few observations and many variables.
Setting up a Partial Least Squares discriminant analysis
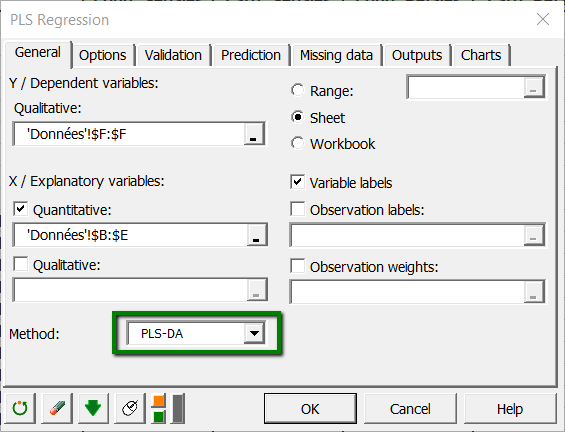
To set up a Partial Least Squares discriminant analysis, you have to use the Partial Least Squares regression dialog box. Start XLSTAT, then select the XLSTAT / Modeling data / Partial Least Squares Regression command in the Excel menu or click the corresponding button on the Modeling data menu.

Once you have clicked the button, the Partial Least Squares regression dialog box is displayed.
In the Dependent variable(s) field, select with the mouse the species.
In Quantitative variable(s) field, select the explanatory variables, that are in our case the physical descriptors of the iris.
The method to be used is PLS-DA for Partial Least Squares Discriminant Analysis.
In the Options tab of the dialog box, make sure that Automatic is activated.
Last, in the Charts tab, the Colored labels option has been activated in order to make the reading of the charts easier.
The computations begin once you have clicked on OK. The results will then be displayed.
Interpreting the results of a Discriminant Analysis
The first results displayed are the classical PLS regression results between the explanatory variables and the species (each specie representing one response variable).
After the tables displaying the basic statistics and the correlations between all the selected variables (dependent variables are displayed in blue and quantitative explanatory variables in black), the results specific to the PLS regression are presented.

The Q² cumulated index measures the global goodness of fit and the predictive quality of the 3 models (one for each specie).
XLSTAT has automatically selected 4 components. We see that Q² remains low even with 4 components (ideally it should be close to 1). This suggests that the quality of the fit varies a lot depending on the specie.
The cumulated R²Y and R²X cum that correspond to the correlations between the explanatory (X) and dependent (Y) variables with the components are very close to 1 with 4 components. This indicates that the 4 components generated by the Partial Least Squares regression summarize well both the Xs and the Ys.
The first correlations map allows to visualize on the first two components the correlations between the Xs and the components, and the Ys and the components.

We can visualize the species and the explanatory variables in that correlation plot.
Once the classical PLS regression outputs have been displayed, the specific PLS discriminant analysis outputs are displayed.
The next table summarizes the classification process. Each observation is classified into the group for the which the function is the highest.. We notice that two observations (3,5) have been reclassified. There are several ways in which these results can be interpreted: either the person who made the measures made an error when recording the values, or the corresponding iris flowers have had a very unusual growth or the criteria used by the specialist to determine the species was not precise enough, or some information necessary to discriminate the flowers is not available here.

The following chart represents the observations on the t axes. It allows to confirm that the species are very well discriminated on the factor axes extracted from the original explanatory variables.

The confusion matrix summarizes the reclassification of the observations, and allows to quickly see the % of well classified observations, which is the ratio of the number of observations that have been well classified over the total number of observations. It is here equal to 85%.

XLSTAT allows you to predict values and use a validation set for PLS discriminant analysis.
Was this article useful?
- Yes
- No