ROC curve analysis in Excel tutorial
This tutorial will show you how to draw and interpret a ROC curve in Excel using the XLSTAT statistical software.
What are ROC curves?
ROC curves were first developed during World War II to develop effective means of detecting Japanese aircrafts. It was then applied more generally to signal detection and medicine where it is now widely used.
The problem is as follows: we study a phenomenon, often binary (for example, the presence or absence of a disease) and we want to develop a test to detect effectively the occurrence of a precise event (for example, the presence of the disease).
If the test is quantitative (possibly ordinal), for example, a concentration of a molecule, we will try to determine from what concentration can a patient be considered as ill. The ROC curves and indices calculated here will help us make the best decision.
Dataset to generate a ROC curve
The data correspond to a medical experiment during which 50 patients, among which 20 are sick, are submitted to a screening test where the concentration of a viral molecule is being measured.
Setting up of a ROC curve
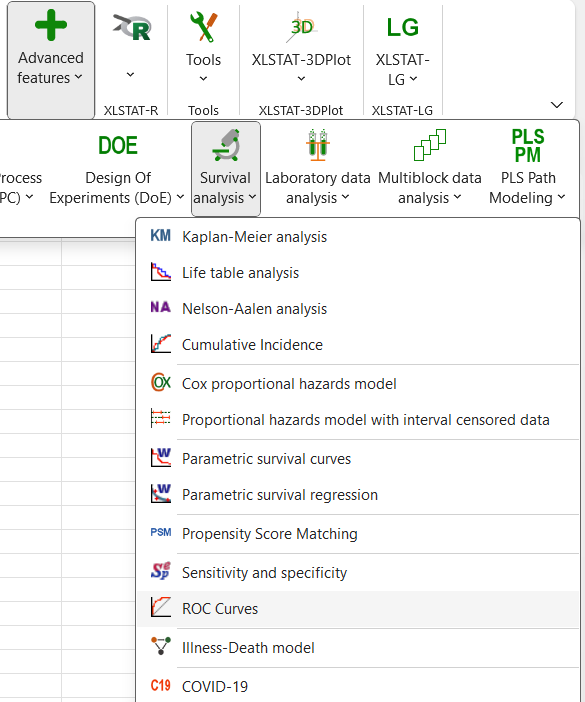
Once XLSTAT has been started, select the Survival analysis / ROC Curves command.
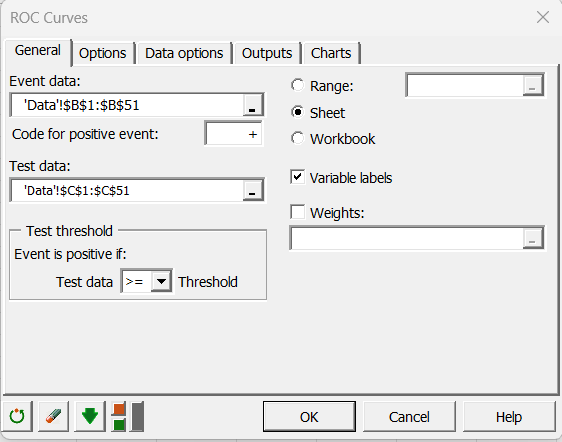
When you click on the button, a dialog box appears. Select the data that correspond to the event data and enter the code that is associated to positive cases.
Then select the data that correspond to the diagnostic test that we are evaluating and specify what type of rule should be used to identify the threshold value below or above which the test should be considered positive.
We choose here to consider that the test is positive if the concentration is greater than or equal to a value to be determined.
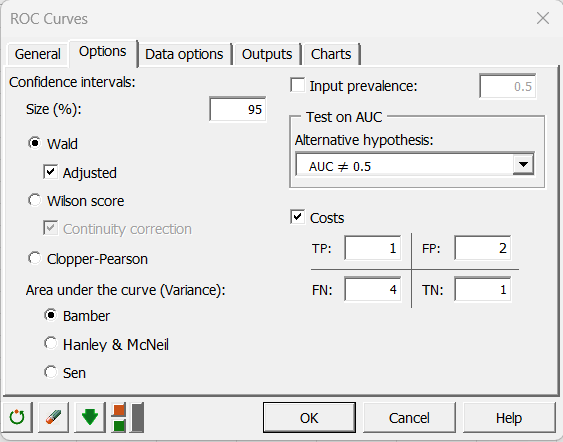
In the Options tab, you can specify the method for calculating the confidence intervals.
XLSTAT is the software offering the widest choice. The defaults are those most recommended.
In this tab, you can also assign a cost to the various cases. We wish to strongly penalize diagnostic errors and more particularly the case where the sick patients are not dete
In the Charts tab, we choose to display a decision plot based on costs.
When you click OK, the computations are done and the results are displayed.
interpretation of a ROC curve
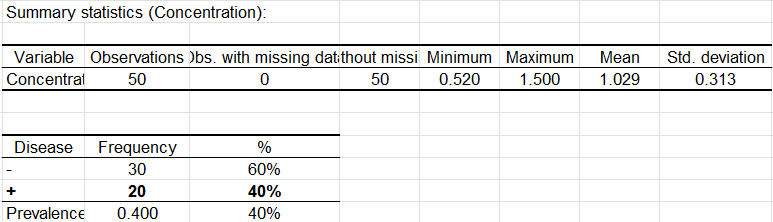
The first table displays the descriptive statistics for the test variable, here the concentration, followed by the statistics for the event variable, here the disease. The prevalence observed on the sample is equal to 0.4.
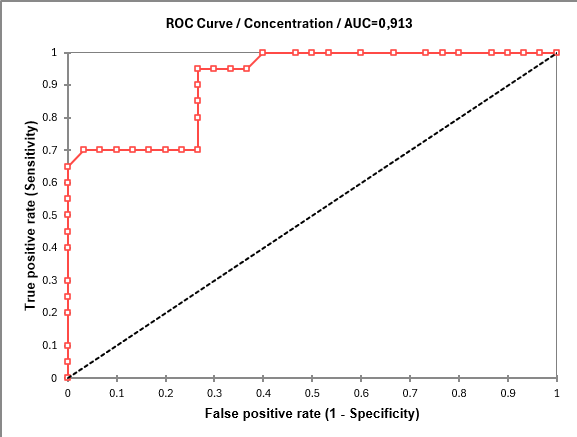
The ROC is then displayed. To each small square corresponds an observation.
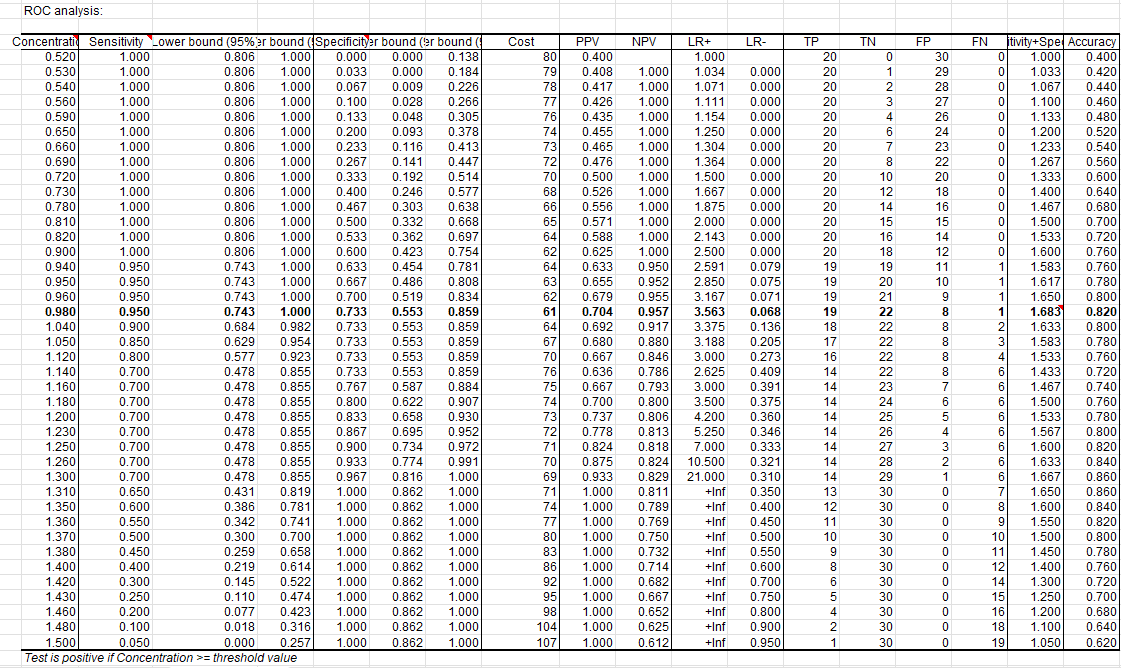
The "ROC Analysis" that follows, displays for each possible threshold value, the value of the various performance indices. For example, if we decide to declare a patient sick when the concentration is greater than or equal to 0.98, the sensitivity is 0.95, the specificity of 0,733 and the cost is 61. For more details on the various indices, you can check the tutorial on sensitivity and specificity analysis.
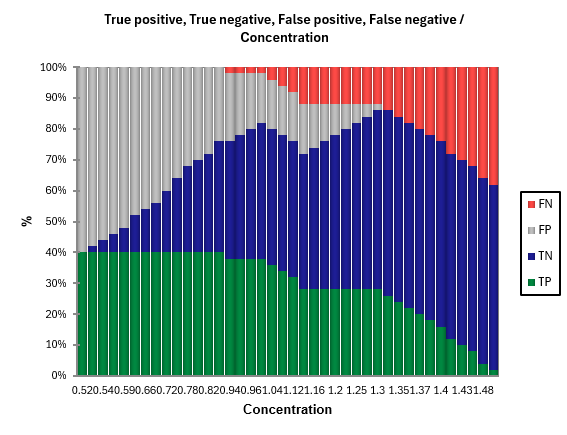
A graph constructed using this table is then displayed. He can see the evolution of counting TP (true positives), TN (true negative), FP (false positives) and FN (false negatives) depending on the chosen threshold value.
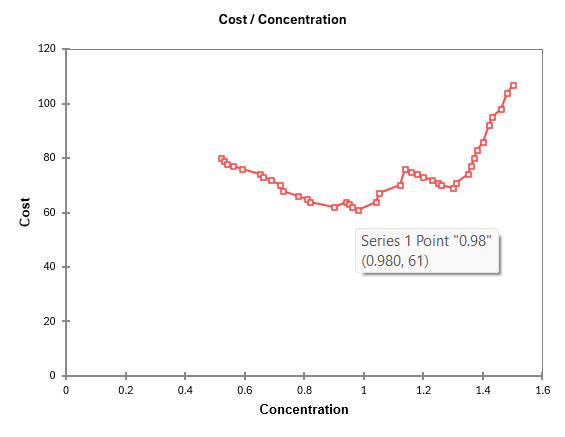
The decision plot allows to choose the threshold value that minimizes the cost. To see what is the minimum threshold value on the chart, just leave your mouse over the corresponding point. This value corresponds to a concentration of 0.98, as we had identified earlier in the table analysis ROC.
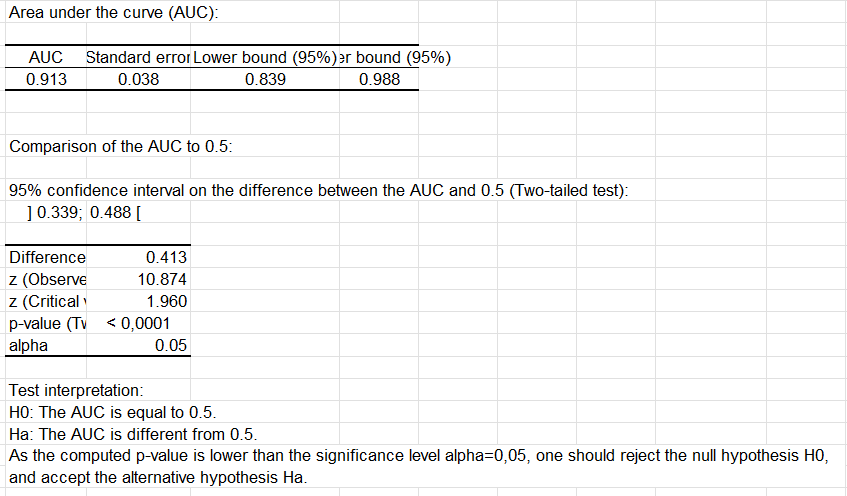
The last series of results allows the study the area under the curve (AUC). The AUC and its confidence interval are calculated. The test that compares the AUC to 0.5 allows to check if the diagnostic test is more powerful than just a random rule. In our case, the test is very powerful and the AUC is significantly different from 0.5.
The comparison of the AUC is also a way to compare different diagnostic tests. XLSTAT can compare as many tests as you like.
Was this article useful?
- Yes
- No