Taguchi design in Excel tutorial
This tutorial explains how to design and analyze a Taguchi design in Excel using XLSTAT.
The Taguchi method is introduced by Genichi Taguchi and is a method for experimental designs providing an improvement to full and fractional factorial designs.
In conventional experimental designs, the goal is to identify the factors that affect the average response and control them at the desired levels. Taguchi's experimental designs deal with the mean and variability of measured characteristic values through the use of signal-to-noise ratios. In this tutorial, we will detail the necessary steps to set up and analyze a Taguchi design.
Goal of this tutorial
In this example, we will present a simple case of a factory manufacturing boat parts. The manufacturer covers the boat parts with paint containing a certain percentage of zinc in order improve the resistance of these parts to marine impacts. Our goal, here, is to determine which factors influence the quality of the paint and identify the optimal level of each factor to obtain a better-quality paint. The quality of the paint is determined by the percentage of zinc.
The results are divided into different sheets: 1. Data: This sheet contains the selected factors. 2. Taguchi design: This sheet contains the Taguchi design and the answers. 3. Taguchi analysis: This sheet contains the results of Taguchi's analysis.
Step 1: Choose the factors
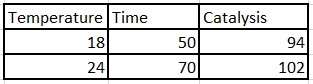
Factors were selected by experts working on the manufacturer's paint process. The selected factors are:
- Ambient temperature.
- The application time of the paint.
- Catalysis volume.
Each factor has two levels:
Step 2: Generate the Taguchi design in XLSTAT
XLSTAT allows you to select a set of factors. Depending on the number of factors and their levels, a list of appropriate Taguchi designs is proposed.
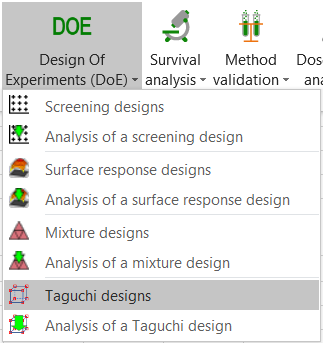
Once XLSTAT is launched, click on the DOE icon and choose the Taguchi design feature.
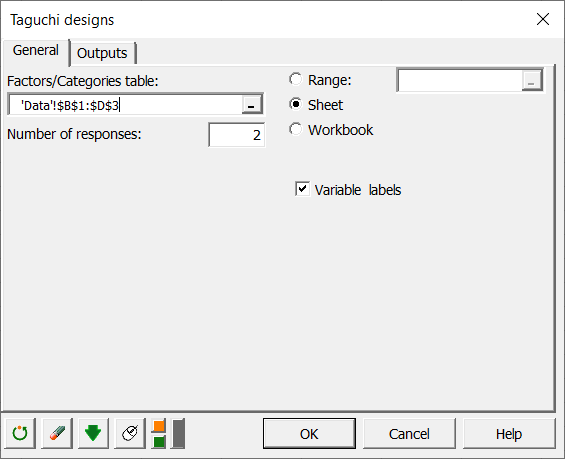 Enter the table of factors and the number of responses, then click on the OK button.
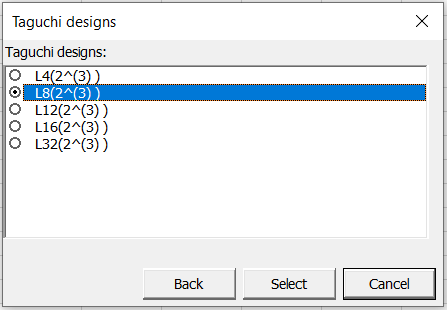
A second dialog box pops up with the proposed Taguchi designs. Select the L8 design which will use 8 different experiences.
Enter the table of factors and the number of responses, then click on the OK button.
A second dialog box pops up with the proposed Taguchi designs. Select the L8 design which will use 8 different experiences.
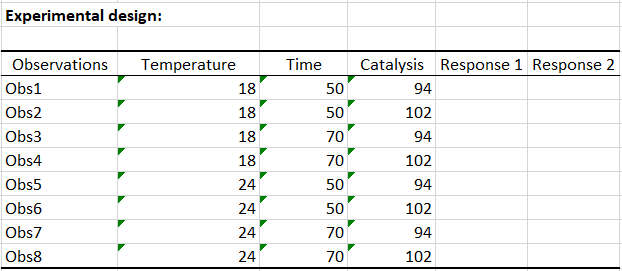
 Once you click the Select button, the calculations are done, and the Taguchi design is displayed.
Step 3: Analyze the Taguchi design table in XLSTAT
As part of this analysis, each experiment was repeated twice.
Once the Taguchi design has been completed, you can click on the Run the analysis button located just below this table. This will automatically launch the pre-filled dialog box. Alternatively, you can click on the DOE icon and choose Taguchi's design analysis function to load the data.
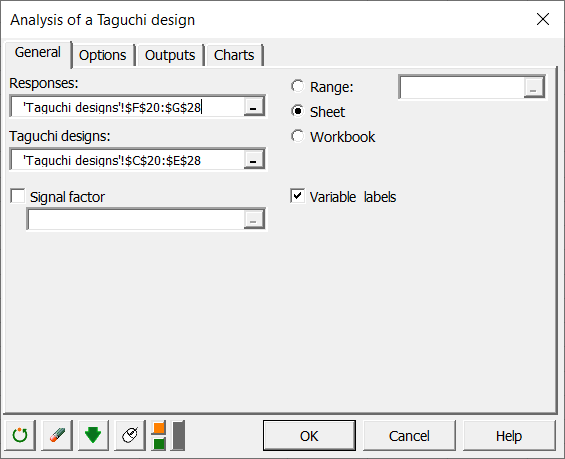 Here, we do not select any signal factor since we created a static Taguchi desing. Use this option if you have created a dynamic Taguchi design.
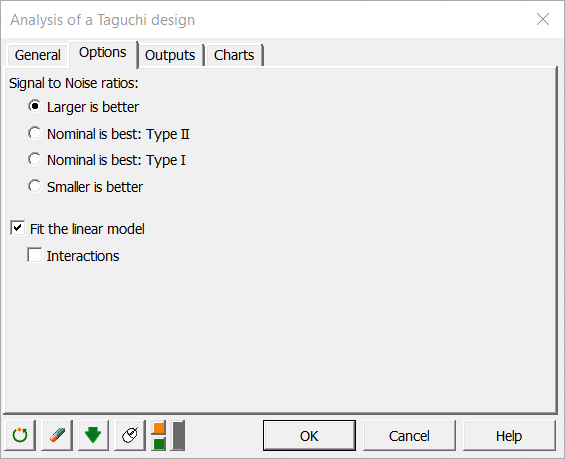 We want to maximize the percentage of zinc, so we choose to use a signal-to-noise ratio "bigger is better". We also choose to adjust the linear model.
Once you have clicked on the OK button, the computations run, and the results are displayed.
We want to maximize the percentage of zinc, so we choose to use a signal-to-noise ratio "bigger is better". We also choose to adjust the linear model.
Once you have clicked on the OK button, the computations run, and the results are displayed.
Interpreting the results of the analysis of Taguchi plan
The first output of high interest is the table of signal-to-noise ratios. The signal-to-noise ratio makes it possible to improve the robustness of the product thus the aim is to maximize it. The higher the signal-to-noise ratio is, the more robust the product will be.
 We observe that a paint produced with an ambient temperature of 24 degrees, an application time of 70 minutes and a catalysis volume of 94 liters will have a higher percentage of zinc. To determine the factors that are statistically significant one can look at the analysis of the variance carried out on the signal-to-noise ratios.
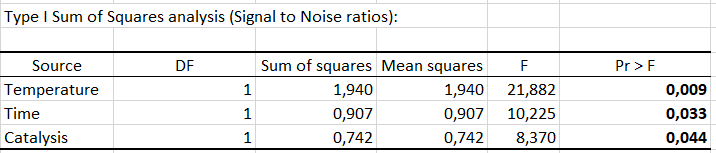 Three factors are statistically significant at the 0.05 significance level.
The model parameters then show the relative importance of each factor in the model.
Three factors are statistically significant at the 0.05 significance level.
The model parameters then show the relative importance of each factor in the model.
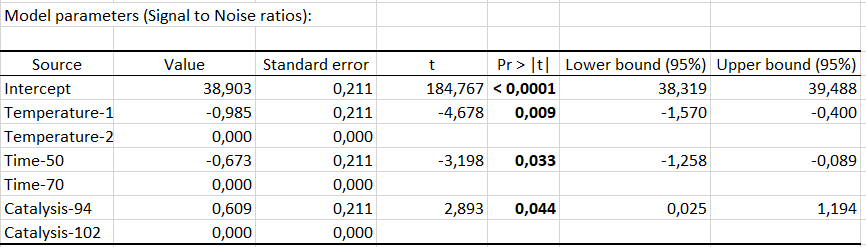 Temperature is the most important factor because the absolute value of its parameter is the highest.
Therefore, we may suggest that an ambient temperature of 24 degrees has the greatest influence on the percentage of zinc in the paint, both on the signal-to-noise ratio and on the average. A time of application of 70 minutes then arrives, followed by a volume of catalysis of 94 liters.
Temperature is the most important factor because the absolute value of its parameter is the highest.
Therefore, we may suggest that an ambient temperature of 24 degrees has the greatest influence on the percentage of zinc in the paint, both on the signal-to-noise ratio and on the average. A time of application of 70 minutes then arrives, followed by a volume of catalysis of 94 liters.
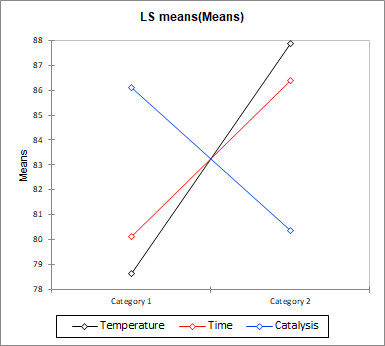
As a conclusion, we should choose to produce paint with the following characteristics:
- Ambient temperature: 24 degrees
- Application time: 70 minutes
- Catalysis volume: 94 liters
The main effect graphs confirm these results:
Was this article useful?
- Yes
- No