Choosing an appropriate Survival analysis tool
This guide will help you figure out which survival data analysis method best fits your needs. All the methods mentioned below can be found under the Survival Analysis menu in XLSTAT, an Excel add-on for Microsoft Office.

What is survival analysis?
Survival analysis methods help studying the time duration until an event happens, also referred to as time to event. The event of interest can be for instance death or relapse or total recovery of patients.
Mainly, survival analysis methods allow investigating:
The survival probability: this is the probability that an individual does not undergo the event of interest before a certain time t. Survival probability can take any value between 0 and 1.
The Hazard: this is the rate at which an individual may have an event occurring during a time unit. For instance, in a study where the time unit is a week, a hazard of 0.3 for a person at risk means that 0.3 event is likely to occur during the week for this person. Note that hazards can take values between 0 and positive infinity.
The following chart compares survival probability through time for two groups of patients receiving either a control treatment or a drug. These probabilities are estimated through a Kaplan-Meier analysis.
The drug treatment seems to improve survival at all time steps. Circles along the drug line indicate right-censored data, which will be explained further down. 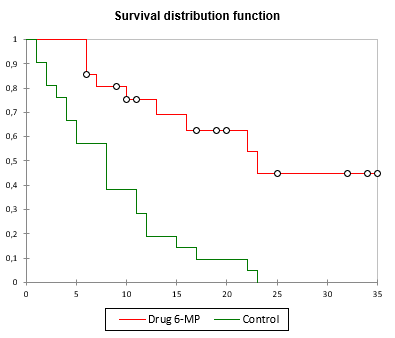
Although they have been developed in the medical field, survival analysis methods are being used in many other domains. In Marketing, it is possible to investigate time to churn of clients according to a set of covariates. Moreover, in industry, time to failure of a machine can also be modeled according to a set of signals measured by sensors.
Censorship, or how to handle partly missing information
Very often, part of the information of time to event can be missing for some patients. For instance, at the end of a study, a subset of patients may still have not undergone the event of interest. In other cases, some patients may stop the follow-up before the event occurs. In both situations, real time to event information is missing in some way. However, survival time until a certain point is still an important information which can be easily incorporated in survival analysis. These data are referred to as right censored. This type of censorship is the most commonly found in survival analysis.
When the event has appeared at some unknown time before the time of the investigation, the data is left censored.
In studies involving regular follow-up over time such as recovery, the event may occur at some point between two distant follow-up dates. For instance, for some patients we may know that recovery occurred somewhere between month 5 and month 10, but with no further precision. This is what is referred to as interval censored data.
Introducing covariates in the analysis
It is always interesting to study the influence of one or several variables on survival probability or hazard. These variables are called covariates or explanatory variables.
Covariates can be qualitative or categorical, and as such allow comparing groups, for instance comparing patients of different origins or undergoing different medical treatments.
Covariates can also be quantitative or numeric. Thus, models such as Cox Proportional Hazards help evaluating the effect of numeric variables such as age or blood pressure on hazards of a specific event.
How is a survival analysis dataset typically structured?
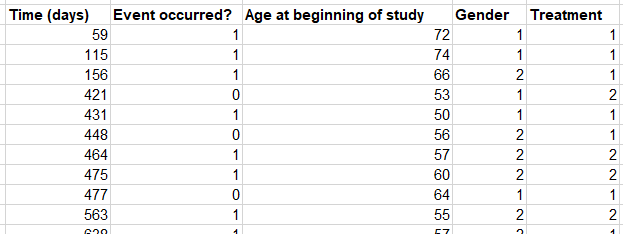
Usually, a typical survival analysis dataset holds one row per patient, and has one column indicating time duration, and another column specifying whether the event has occurred at the end of this duration or not (right censored).
If covariates are available, they are introduced in additional columns.
Which survival analysis method should you choose?
The following grid helps choosing an appropriate method according to the questions and the purposes of the study.
| Method | Covariates | Remarks |
|---|---|---|
| Life Table Analysis | Only allows comparing groups. | Allows defining specific time intervals to investigate survival probability. Intervals can be regular or user-defined. |
| Kaplan-Meier Analysis | Only allows comparing groups. | Allows for time to event quantile estimation. Example: probability of event is 25% in the first 8 months. |
| Nelson-Aalen Analysis | Only allows comparing groups. | Similar to Kaplan-Meier, but more suitable to investigate hazard functions instead of survival functions. |
| Cumulative Incidence | Only allows comparing groups. | Allows investigating several types of competing events. Example: in a study on cancer, patients may die of cancer but also of other competing causes. |
| Cox Proportional Hazards Model | Estimates coefficients and significance for both quantitative and qualitative covariates, as well as interaction effects. | Allows for left and interval censoring in XLSTAT. Has a few assumptions to check. |
| Parametric Survival Regression | Estimates coefficients and significance for both quantitative and qualitative covariates, as well as interaction effects. | Allows estimating parameters linked to a theoretical distribution. Requires experience in statistical distributions. |
| Parametric Survival Curves | Only allows comparing groups. | Useful for describing and comparing parametric survival curves of several groups. |
Was this article useful?
- Yes
- No