k-means clustering in Excel tutorial
This tutorial will help you set up and interpret a k-means Clustering in Excel using the XLSTAT software.
Not sure if this is the right clustering tool you need? Check out this guide.
Dataset for k-means clustering
Our data is from the US Census Bureau and describes the changes in the population of 51 states between 2000 and 2001. The initial dataset has been transformed to rates per 1000 inhabitants, with the data for 2001 being used as the focus for the analysis.
Goal of this tutorial
Our aim is to create homogeneous clusters of states based on the demographic data we have available. This dataset is also used in the Principal Component Analysis (PCA) tutorial and in the Hierarchical Ascendant Classification (HAC) tutorial.
Note: If you try to re-run the same analysis as described below on the same data, as the k-means method starts from randomly selected clusters, you will most probably obtain different results from those listed hereunder, unless you fix the seed of the random numbers to the same value as the one used here (4414218). To fix the seed, go to the XLSTAT Options, Advanced tab, then check the fix the seed option.
Setting up a k-means clustering in XLSTAT
-
Once XLSTAT is open, click on Analyzing data / k-means clustering.
-
The k-means clustering dialog box appears.
-
Select the data on the Excel sheet. In this example, the data starts from the first row, so it is quicker and easier to use the column selection mode. This explains why the letters corresponding to the columns are displayed in the selection boxes.
-
The TOTAL POPULATION variable was not selected, as we are interested mainly in the demographic dynamics. The last column (> 65 POP. EST.) was not selected because it is fully correlated with the column preceding it.
-
Since the name of each variable is present at the top of the table, we must check the Variable labels checkbox.
-
The selected criterion is the Determinant(W) as it allows you to remove the scale effects of the variables.
-
The Euclidean distance is chosen as the dissimilarity index because it is the most classic one to use for k-means clustering.
-
We set the number of clusters to create to 4.
-
Finally, the row labels are selected (STATE column) because the name of the state is specified for each observation.

-
In the Options tab, we increased the number of repetitions to 10 to increase the quality and stability of the results.
-
Finally, in the Outputs tab, we can choose to display one or several output tables.
Interpreting a k-means clustering
After the basic descriptive statistics of the selected variables and the optimization summary, the first result displayed is the inertia decomposition table.
The inertia decomposition table for the best solution among the repetitions is displayed. (Note: Total inertia = Between-classes inertia + Within-class inertia).

After a series of tables that include the class centroids, the distance between the class centroids, the central objects (here, the state that is the closest to the class centroid), a table shows the states that have been classified into each cluster.

Then a table with the group ID for each state is displayed. A sample is shown below. The cluster IDs can be merged with the initial table for further analyses (discriminant analysis for example.).
The Correlations with centroids and Silhouette scores options are activated, then the associated columns are displayed in the same table:

A graph representing silhouette scores allows you to visually study the goodness of the clustering. If the score is close to 1, the observation lies well in its class. On the contrary, if the score is close to -1, the observation is assigned to the wrong class.

Mean silhouette scores by class allow you to compare classes and tell which one is the most uniform according to this score.
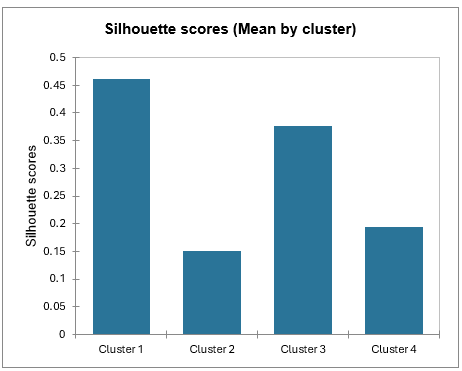
Class 1 has the highest silhouette scores. Meanwhile, Class 2 has a score close to 0, which means 4 is not the best number of classes for this data. In the tutorial on Agglomerative Hierarchical Clustering (AHC), we see that the States would better be clustered into three groups.
This video shows you how to group samples with the k-means clustering.
Was this article useful?
- Yes
- No