Violin plot in Excel
This tutorial will help you set up and interpret a Violin plot using the XLSTAT-R engine in Excel.
What is a violin plot?
A violin plot is a method of plotting numerical data combining the vision of the probability density of each variable with its associated boxplot or dots.
The violin plot function developed in XLSTAT-R calls the geom_violin function from the ggplot2 package in R (Wickham H).
Dataset for plotting a violin plot in XLSTAT-R
The data correspond to the Iris dataset in the datasets package of R. This famous (Fisher’s or Anderson’s iris data set gives the measurements in centimeters of the variables sepal length and width and petal length, respectively, for 50 flowers from each of 3 species of iris. The species are Iris setosa, versicolor, and virginica. It was originally published by Fisher, R. A. (1936) The use of multiple measurements in taxonomic problems. Annals of Eugenics, 7, Part II, 179-188.
The goal here is to compare the distributions of each variable (sepal length, sepal width, and petal length) according to the different species.
Setting up a violin plot with XLSTAT-R
Once XLSTAT is open, select the XLSTAT-R / plots / Violin plots (geom_violin) command as shown below:

The next dialog box opens:
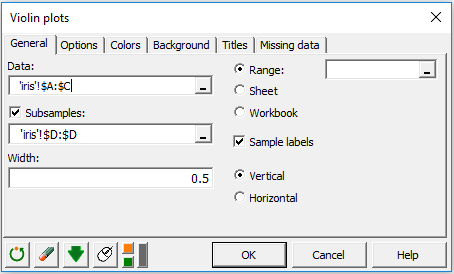
In the General tab, select the range A1:C151 in the Data field as well as the range D1:D151 in the Subsamples field**.**
Subsamples should be a qualitative variable and allow displaying a different violin plot for each category. Width controls how close the violin plots of one category are.
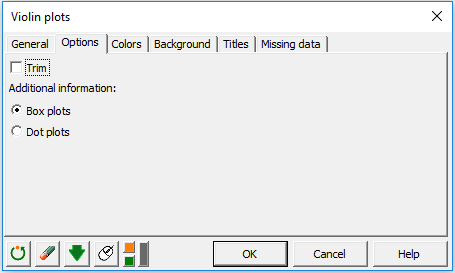
In the Options tab, select boxplot if you want to add a boxplot on the violin plot, or Dot plots if you want to add dots on the violin plot. Activate the **Trim option if you want to trim the tails of the violins to the range of the data.
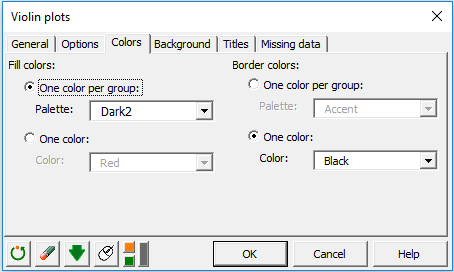
In the Colors tab, you have access to two attributes: Fill colors and Border colors.
In both cases, you can select either an existing palette, which allows using one color per sample or a unique color for every violin plot.
Interpretation of a violin plot output
The produced violin plot is displayed on the following graph:

Setosa seems to have smaller Sepal length but quite the same Sepal width than other species. We may also suggest that Setosa has clearly smaller Petal length than the other species. We can check those first conclusions by applying hypothesis tests (k samples comparison of variance, two sample t-test, etc).
Was this article useful?
- Yes
- No