Durbin, Skillings-Mack test in Excel tutorial
This tutorial will help you run and interpret a Durbin, Skillings-Mack test in Excel using XLSTAT. Not sure this is the statistical test you are looking for? Check out this guide
What is the Durbin, Skillings-Mack test used for ?
The Durbin, Skillings-Mack test is used to identify if a product is judged as particularly different from the other products of a set. It is similar to Friedman’s test but can be applied in case of incomplete data blocks, in our case if all the judges from the study have not evaluated all the products.
As in every statistical test, we have a null hypothesis and an alternative hypothesis :
- H0 : the t treatments are not significantly different
- Ha : at least one of them is different from another
Dataset in order to run a Durbin test
The data contain the ratings of 5 products (in columns) by 10 judges (in lines). Here, we have chosen a Durbin test because the judges’ ratings are reliable only for three products so we have incomplete data and we cannot run a Friedman test.

Setting up a Durbin, Skillings-Mack test in XLSTAT
Begin by launching the analysis by clicking on Durbin, Skillings-Mack test in the Nonparametric tests menu in XLSTAT.

Once the analysis is launched, the dialog box appears. You can then select the data on the Excel sheet. Do not forget to check Treatment labels if you have entered the product names. You can also choose to run Mutliple pairwise comparisons.
 In the Options tab, we choose to calculate the asymptotical p-values in order to proceed like most softwares. However, you can use the exact p-values or the Monte-Carlo method.
The calculations start when you click on the OK button and then the results are displayed.
How to interpret a non parametric Durbin test
As a reminder, a Block design is an experimental design in which we study the influence of two factors on one or more phenomena. Here, the factors are the blocks (or judges) and the products. The studied phenomenon is the similarity between the products.
A complete block design is a design in which all levels of the factors of interest are present once within each block : each judge has evaluated every product. It is not the case here so we have an incomplete block design.
Moreover, a block designed is balanced if each level of the factor of interest are present a same number of times r in the design, and if each pair of levels of each factor is present the same number of times λ. Here, each judge has evaluated three products and each product has been evaluated by 6 judges, so the design is indeed balanced.
Back to our results, the analysis returns a summary statistics table.

We can for each product see the name, the number of observations (with and without missing data) as well as the minimum, maximum, and mean grades with their standard deviation.
Then, we can see the results of a Balanced Incomplete Block design Durbin test.
 We get a p-value lower than 0.05 so we can reject the null hypothesis H0 and conclude that at least one of the products is different from another.
The Durbin-Cabilio-Alvo test leads us to the same conclusion.

The Conover procedure enables us to make product groups based on their evaluations. For instance, group A contains products 4, 1 and 5 while group B contains products 1, 5 and 3 and group C contains products 5, 3 and 2.
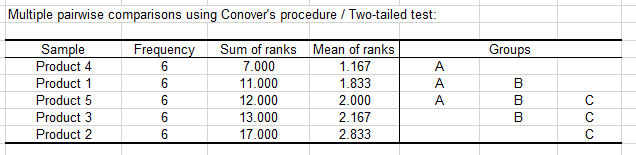 A significant differences table is also displayed. For instance, product 1 has been evaluated to be significantly different from product 2.

Was this article useful?
- Yes
- No