Generalized Additive Model or GAM in Excel
This tutorial will help you set up and interpret a Generalized Additive Model or GAM using the XLSTAT-R engine in Excel.
What is a Generalized Additive Model or GAM?
Generalized Additive Models or GAMs allow modeling an outcome according to nonlinear smoothing functions of predictors. Cubic splines are among the commonly used nonlinear functions in this context. The GAM function developed in XLSTAT-R calls the gam function from the mgcv package in R (Simon Wood).
Data set for launching a Generalized Additive Model in XLSTAT-R
The data are a subset from the Wine Quality dataset (P. Cortez, A. Cerdeira, F. Almeida, T. Matos and J. Reis. Modeling wine preferences by data mining from physicochemical properties. In Decision Support Systems, Elsevier, 47(4):547-553, 200). The data set includes physicochemical properties of wine samples along with quality scores ranging from 0 (very bad) to 10 (very excellent). Only the red wine samples, as well as the density, pH, Sulphates, Alcohol and quality score variables, are kept for this tutorial.
The goal here is to investigate the nonlinear effects of the four physicochemical variables on wine quality using GAMs.
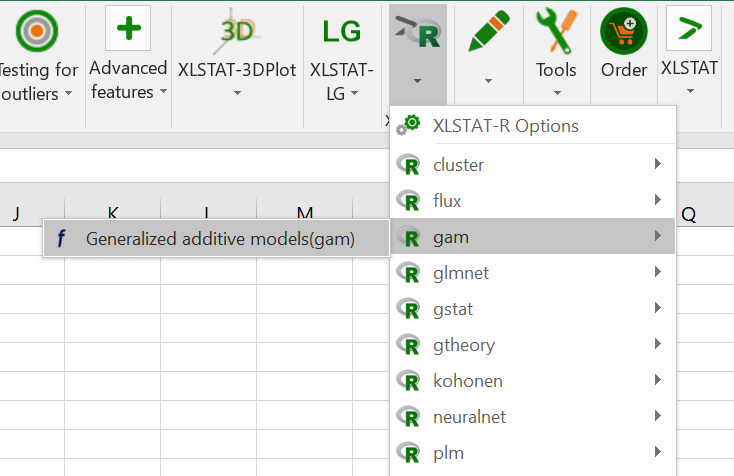
Setting up a Generalized Additive Model (GAM) in XLSTAT-R
Open XLSTAT-R / gam / Generalized additive models(gam)
 In the general tab, select Quality score as the dependent variable. The score is numerical, thus select the Gaussian family.
Select all the physicochemical data under the Explanatory quantitative variables field.
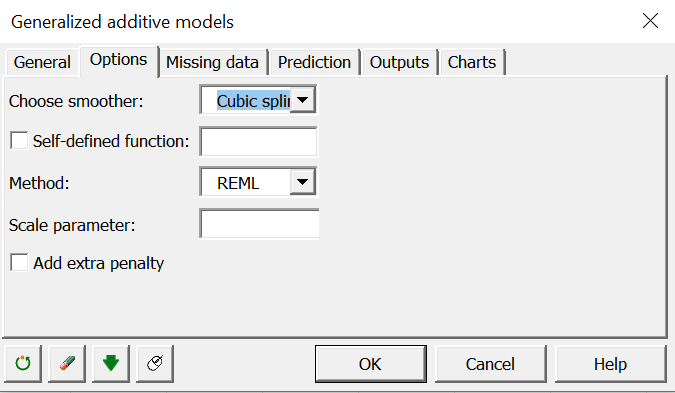
 In the Options tab, select the Cubic Spline smoother. XLSTAT-R will automatically generate a GAM model using common default settings. As GAM function specification can be quite complex, XLSTAT-R allows to optionally enter your own GAM model written in R syntax respecting the gam function specifications. If you do so, make sure you specify the correct variable names and to match the case (lowercase/uppercase). Here is an example matching our data: quality~s(pH,alcohol,k=3)+s(density)+s(sulphates)
If you set a self-defined function, the Choose Smoother choice above is ignored. It is possible to add extra penalty to let some coefficients be penalized to zero.
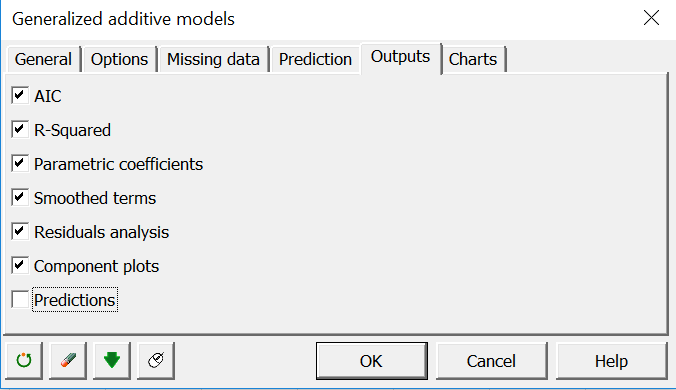
 Select all outputs except predictions as we did not specify any prediction set in the Predictions tab.
 Click OK to launch computations.
Interpretation of a Generalized Additive Model GAM analysis
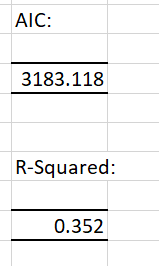
The AIC and the model’s R-squared are first displayed:
 Both parametric and smoothed terms and the associated p-values can then be investigated:
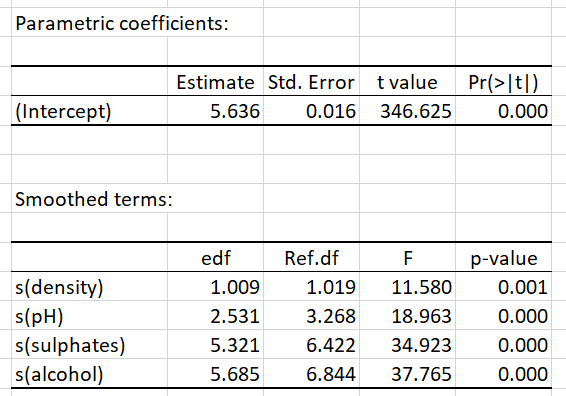 It looks like all physicochemical variables have a significant non-linear effect on the score.
This can be explored on the Components charts at the bottom of the report:
It looks like all physicochemical variables have a significant non-linear effect on the score.
This can be explored on the Components charts at the bottom of the report:
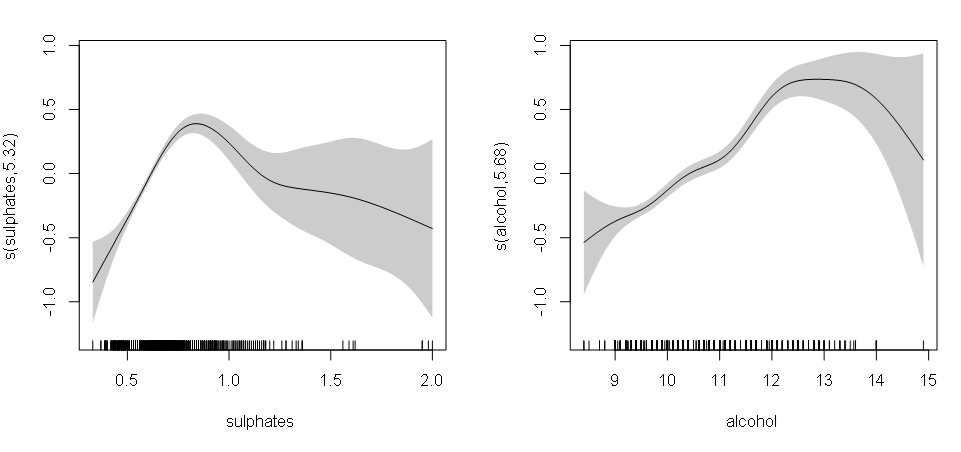 Within each component plot, the black line is the nonlinear function of the corresponding explanatory variable and the grey band is the confidence envelope. We see that quality score increases abruptly from low to intermediate levels of sulfates before going down at high levels of sulfates.
It could be interesting to remove some outliers (i.e. samples with sulfates>1.5 or alcohol >14) and relaunch the analysis, thus focusing more on the bulk of the data.
Within each component plot, the black line is the nonlinear function of the corresponding explanatory variable and the grey band is the confidence envelope. We see that quality score increases abruptly from low to intermediate levels of sulfates before going down at high levels of sulfates.
It could be interesting to remove some outliers (i.e. samples with sulfates>1.5 or alcohol >14) and relaunch the analysis, thus focusing more on the bulk of the data.
War dieser Artikel nützlich?
- Ja
- Nein