Neural Networks in Excel
This tutorial will help you set up and interpret a Neural Network using the XLSTAT-R engine in Excel.
What are Neural Networks?
Neural networks (NN) are powerful machine learning algorithms used in a variety of disciplines such as pattern recognition, data mining, medical diagnosis and fraud detection. The idea, in simple words, is that a neural network receives a large amount of information and then develops a system to learn from this information. For example, in speech recognition, NN can learn from sound recordings and then use this knowledge to transform sounds into text.
A neural network is composed of a number of interconnected neurons (nodes) organized in a series of layers (input, hidden and output layer).
The Neural Network function developed in XLSTAT-R calls the neuralnet function from the neuralnet package in R (Stefan Fritsch).
Dataset for fitting a neural network in XLSTAT-R
The data correspond to the Boston dataset in the MASS package. It contains information on the housing values in the suburbs of Boston such as the per capita crime rate by town, the average number of rooms per dwelling and the median value of owner-occupied homes. It was originally published by Harrison, D. and Rubinfeld, D.L. `Hedonic prices and the demand for clean air', J. Environ. Economics & Management, vol.5, 81-102, 1978.
The goal here is to predict the median value of owner-occupied homes using all the other variables available. For the purpose of this tutorial, the initial data has been rescaled and randomly split it into a training and a test data set.
Setting up a neural network with XLSTAT-R
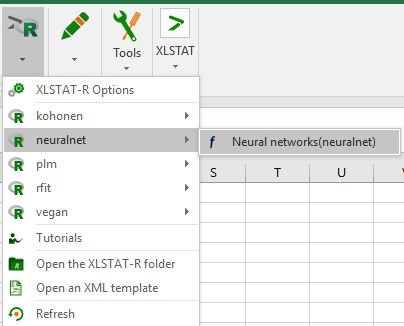
Once XLSTAT is open, select the XLSTAT-R / neuralnet / Neural networks command as shown below:
 The next dialog box opens:
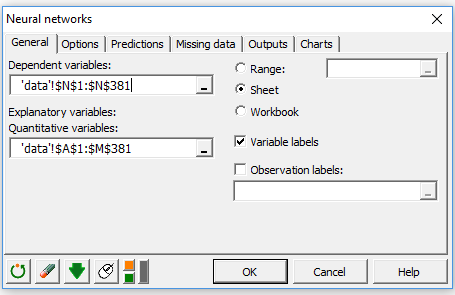
In the General tab, select the range N1 :N381 in the Dependent variables field as well as the range A1 :M381 in the Explanatory Quantitative variables .The selected data corresponds to the train data.
 In the Options tab, enter 5,3 in the Neurons per layer field in order to define the number of neurons in the hidden layers. The algorithm RProp+ refers to the resilient backpropagation with weight backtracking.
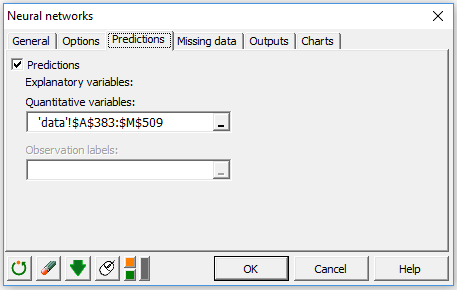 In the Predictions tab, select the range A383 :M509 in the Explanatory Quantitative variables field. These observations come from the test data.
Click OK to launch computations.
In the Predictions tab, select the range A383 :M509 in the Explanatory Quantitative variables field. These observations come from the test data.
Click OK to launch computations.
Interpretation of a neural network output
The fitted neural network is represented by the following graph:
 The black lines show the linkages between each layer and the weights on each linkage while the blue lines show the bias term added in each step .The results displayed in the graph are also provided in the Weights table of the XLSTAT output.
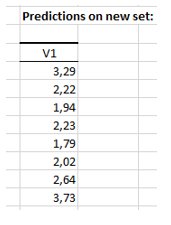
The predictions made are displayed in the next table for the first few observations of the test data set :
 To visualize the performance of the neural network, we can plot the predicted medv versus the actual medv (see below). We observe a strong correlation between the model’s predictions and the actual values. Thus we may suggest that the model predicts well.
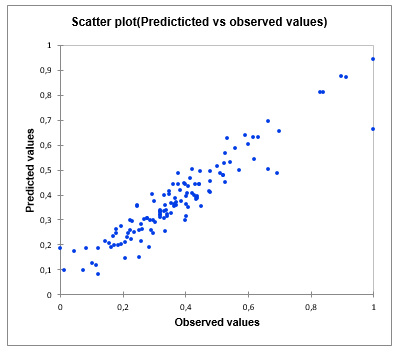
Source: https://www.r-bloggers.com/fitting-a-neural-network-in-r-neuralnet-pac
War dieser Artikel nützlich?
- Ja
- Nein